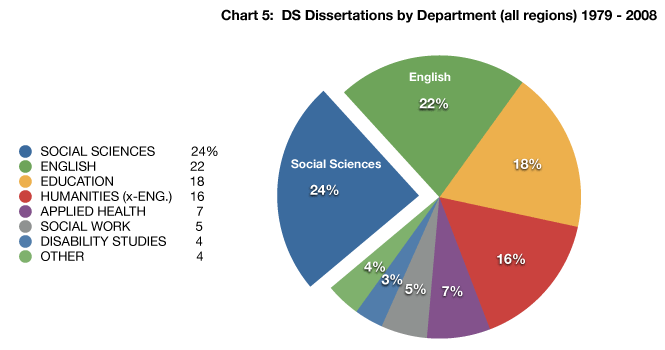
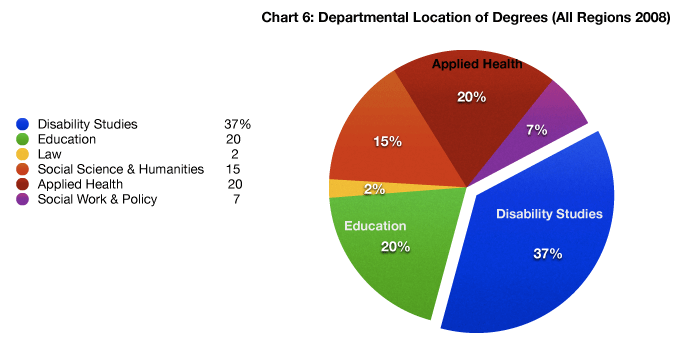
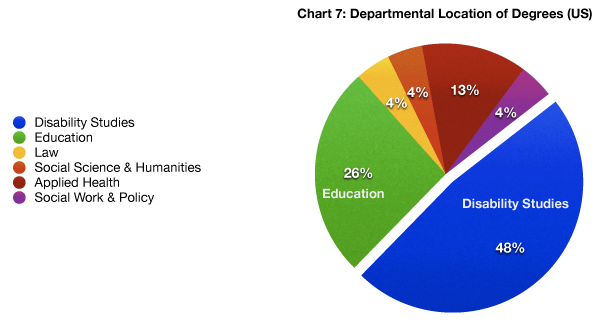
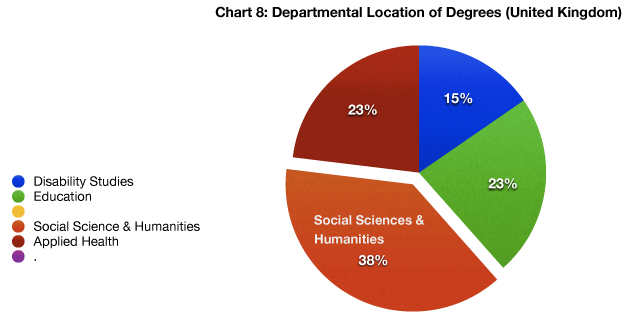
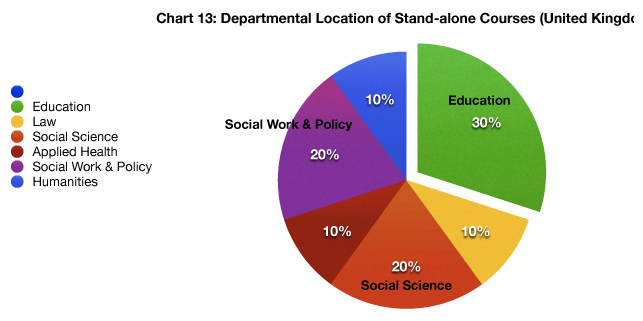
chart one: growth in all courses in all regions 2003 to 2008: a bar graph indicating growth in three categories

chart two: courses offered per program: a pie chart indicating the percentage of programs that offer a given number of classes

chart three:  disability studies overview for all regions from 1999 to 2008: a bar graph comparing degree offerings at three times

chart four: disability studies overview: courses growth in the US and Canada 1981 to 2008: a bar graph showing the number of courses offered in five individual years during that time span

chart five: disability studies dissertations by department for all regions from 1979 to 2008: a pie chart divided by department

chart six: departmental location of degrees for all regions, 2008: a pie chart divided by department

chart seven: departmental location of degrees in the united states: a pie chart divided by department

chart eight: departmental location of degrees in the united kingdom: a pie chart divided by department

chart nine: departmental location of degrees in canada: a pie chart divided by department

chart ten: departmental location of degrees in australia and new zealand: a pie chart divided by department

chart eleven: departmental location of stand-alone courses in all regions: a pie chart divided by department

chart twelve: departmental location of stand-alone courses in the united states: a pie chart divided by department

chart thirteen: departmental location of stand-alone courses in the united kingdom: a pie chart divided by department

chart fourteen: departmental location of stand-alone courses in canada: a pie chart divided by department

chart fifteen: departmental location of stand-alone courses in australia and new zealand: a pie chart divided by department

Return to Top of Page