
As subminimum wage is a prominent and problematic issue affecting the lives of many people with disabilities in United States, and as it is linked to discrimination, the aim of this study was to explore how prejudice impacts the use of special wage certificates and subminimum wage across the United States. Since in the United States employment discrimination has historically been tied to racism and sexism, in addition to ableism, we also were interested in exploring how those factors may impact the use of special wage certificates. To do so, we analyzed data about the use of special wage certificates around the United States, and prejudice data from 4.70 million people. Our findings revealed significant links between subminimum wage and not only ableism, but also racism. Subminimum wage practices are discriminatory and help normalize oppression.
Ableism, Racism, and Subminimum Wage in the United States
The United Nations (1948) Declaration of Human Rights notes, "everyone has the right to work, to free choice of employment, to just and favourable conditions of work and to protection against unemployment. Everyone, without any discrimination, has the right to equal pay for equal work" (n.p.). Moreover, the Convention on the Rights of Persons with Disabilities (CRPD) also stresses:
States Parties recognize the right of persons with disabilities to work, on an equal basis with others; this includes the right to the opportunity to gain a living by work freely chosen or accepted in a labour market and work environment that is open, inclusive and accessible to persons with disabilities. States Parties shall… prohibit discrimination on the basis of disability with regard to all matters concerning all forms of employment,… protect the rights of persons with disabilities, on an equal basis with others, to just and favourable conditions of work, including equal opportunities and equal remuneration for work of equal value, safe and healthy working conditions,… [and] ensure that persons with disabilities are not held in slavery or in servitude, and are protected, on an equal basis with others, from forced or compulsory labour. (United Nations, 2006, n.p.)
In the United States, people with disabilities' right to work without discrimination is also enforced by the Americans with Disabilities Act (1990).
Despite these civil and human rights, many companies in the United States are able to pay people with disabilities subminimum wage because of Section 14(c) of the Fair Labor Standards Act (FLSA) (Maurer, 2011). As a result of Section 14(c), the government can grant employers 'special wage certificates,' thus allowing them to avoid paying people the state or federal minimum wage (Maurer, 2011). In fact, a significant number of people with disabilities in the United States are currently working for one to two dollars a day (National Disability Rights Network, 2011; Rogan & Rinne, 2011).
History of Subminimum Wage in the United States
FLSA Section 14(c) was introduced in the 1930s in an attempt to ensure people with disabilities were indeed paid based on their performance (Maurer, 2011; Whittaker, 2005). However, since its introduction, Section 14(c) has been rife with conflict. For example, in 1967, at the urging of Congress, the United States Department of Labor conducted an in-depth examination of subminimum wage practices. The report found that sheltered workshops themselves, rather than people with disabilities, were largely to blame for reduced productivity (Whittaker, 2005). Similarly, in 1977, the Department of Labor also testified in a Congressional hearing that subminimum wage was problematic because "'many of the managers of the sheltered workshops are not sufficiently knowledgeable in costing and pricing… essential elements of a successful workshop operation'" (Whittaker, 2005, p. 13).
A few years later (1980), in a House Subcommittee on Labor Standards hearing about Section 14(c), the Department of Labor also,
confirmed that its oversight of the [Section 14(c)] program had been inadequate… The wage rate determination process, it was argued, was inadequate… The Wage and Hour Division [of the Department of Labor] did not have an accurate barometer against which to measure the productivity of the worker [with disabilities]… Nor did employers of [people with disabilities] provide a totally clear picture of who they were and what their mission was. (Whittaker, 2005, p. 14)
Around the same time, a representative from the National Federation for the Blind (NFB), as well as others, including House Representatives themselves, critiqued sheltered workshops for portraying people with disabilities as both clients (i.e. rehabilitation service recipients) and employees. The NFB representative argued,
the sheltered institutions were basically industries that 'have covered their business activities with a veil of 'social services'' and labeled their workforce as 'clients' thereby allowing them to argue for the benefits of special workshops, yet they do 'very little rehabilitation and a whole lot of business and industrial activity.' (Whittaker, 2005, p. 18).
This practice is also problematic as these companies may benefit from Medicaid funding and other public subsidies, while also serving as competitive private sector corporations (Whittaker, 2005).
In 1981, the United States General Accounting Office issued a report on sheltered workshops which found less than one-twentieth of sheltered workshops were investigated annually. Yet of those investigated, 60% underpaid their workers even according to subminimum wage standards (Whittaker, 2005). In an attempt to remedy some of these problems, Section 14(c) of the FLSA was amended and restructured in 1986 so that wage floors (wage minimums) could be removed. This amendment aimed to improve the wages of people with disabilities, so they actually reflected their contributions. Unfortunately, the move away from a wage floor did not go as planned and did not result in people with disabilities being paid more; as a result, it failed to address what ultimately was a structural problem (Whittaker, 2005).
As there were still problems, in 1994, Congressional hearings declared productivity-based subminimum wage inequitable and unworkable; however, ultimately, no changes were made (Whittaker, 2005). Another attempt at reform occurred in 2001 when the General Accounting Office released a new study reporting the Department of Labor had "not effectively managed the special minimum wage program to ensure that 14(c) workers receive the correct wages" (Whittaker, 2005, p. 34); yet still, no changes were made.
Almost a decade later, another attempt was made to remedy subminimum wage problems, this time through legislation. The Fair Wages to Workers with Disabilities Act (H.R. 3086), was introduced to discontinue the issuing of special wage certificates, phase out existing special wage certificates, and repeal Section 14(c). The bill had bipartisan support with 82 cosponsors (65 Democrats, 17 Republicans) and was widely supported by major national disability groups that advocate for many different types of people with disabilities; however, the bill died in the House in 2011 (Civic Impulse, 2016; Madrigal, 2011).
Subminimum Wage Today
Section 14(c) is "rooted in the premise that, in order 'to prevent curtailment of opportunities for employment,' a wage rate 'lower than' the otherwise applicable FLSA minimum may be justified" (Whittaker, 2005, pp. 35-36). Yet, findings from numerous Department of Labor, and General Accounting Office reports, and Congressional hearings have revealed that not only do employers not adequately pay people under subminimum wage, subminimum wage is also discriminatory (Whittaker, 2005). In theory, subminimum wage is supposed to be based on workers' productivity; however, research has found that companies utilizing these certificates always ends up paying below the minimum wage, regardless of their employees' productivity (Maurer, 2011). In fact, there is little evidence of subminimum wage's effectiveness, other than to the bottom line of organizations who wish to profit off cheap labor. For example, Goodwill Industries, which has a total revenue of $5.59 billion, gets donations and government contracts that supplement their business model, while still paying people with disabilities subminimum wage (Dejean, 2017). Moreover, some companies pay people with disabilities a subminimum wage while doing the exact same job as nondisabled workers who are paid above minimum wage (Elk, 2013). This discrimination is often based on misconceptions about the abilities and contributions of people with disabilities (Maurer, 2011).
Research has found many people who at one time were paid subminimum wage demonstrate their ability to work successfully in the community on normal wages once their job is appropriately matched with their skills (Butterworth, Hall, Hoff, & Migliore, 2007). Moreover, supported employees in integrated employment actually generate fewer costs for organizations than those in sheltered workshops (Cimera, 2011). They also do so while making more money and costing businesses less (Cimera, 2011).
In an individualized neoliberal society, such as the United States, subminimum wage is also a barrier to true community participation and citizenship. While people's value should not be tied to their ability to work and it is important to note the role economic structures play in disability oppression (Barnes, 1997; Charlton, 1998; Duggan, 2003; Taylor, 2004), people have the right to work if they want to. People should also have the right to be paid fairly for that work. Yet, in addition to being socially devalued, people on subminimum wages often get stuck in a cycle of poverty. People with disabilities making subminimum wage also lack purchasing power, and as a result, have no effective way to get out of this system and into the integrated work market.
In addition, it is important to recognize that disability and ableism do not exist in a vacuum – not only do people with disabilities have intersecting identities, intersecting systems of oppression also operate simultaneously and often intertwine, not only within the employment arena, but also in the United States at large (Annamma, Connor, & Ferri, 2013; Bell, 2006; Darity & Mason, 1998; Erevelles, 2011; Erevelles & Minear, 2010; Garland-Thomson, 2005; Kumari-Campbell, 2009; National Women's Law Center, 2017; O'Leary, 2017; O'Toole, 2013; Pager & Shepherd, 2008; Quillian, Pager, Hexel, & Midtbøen, 2017; Yearby, n.d.). For example, slavery not only played a key role in shaping and growing America's economy prior to reconstruction, but it also has a lasting legacy on the United States economy today (Beckert & Rockman, 2016). Moreover, people of color, especially people of color with disabilities, continue to face widespread and systemic racism (Annamma et al., 2013; Bell, 2006; Erevelles & Minear, 2010; O'Toole, 2013). In the United States employment discrimination is tied to racism and sexism, in addition to ableism (Bureau of Labor Statistics, 2018a, 2018b; National Women's Law Center, 2017). For example, different people are also funneled into different kinds of work (Reskin, 1988). These different 'types' of work, such as gendered work, "reinforce already existing inequalities in the labour market" (Hughes, McKie, Hopkins, & Watson, 2005, p. 261). Moreover, in addition to a larger systemic pay gap between men and women in general, pay gaps intensify for White people with disabilities, and women of color with and without disabilities (National Women's Law Center, 2017). Ableism, racism, and sexism impact not only who is hired, but in what positions, how much people are paid, how they are treated at their job, and their advancement opportunities.
As subminimum wage is a prominent and problematic issue affecting the lives of many people with disabilities, and as it is linked to discrimination, the aim of this study was to explore how prejudice impacts the use of special wage certificates and subminimum wage across the United States. Since ableism, racism, and sexism intersect, including regarding employment discrimination, we also were interested in exploring how those factors may impact the use of special wage certificates. We had the following research questions:
- How do ableism, racism, sexism, population size, wealth, and political orientation impact if special wage certificates are used in a region?
- How do ableism, racism, sexism, population size, wealth, and political orientation impact how many subminimum wage certificates are used in a region?
- How do ableism, racism, sexism, population size, wealth, and political orientation impact how many people are paid subminimum wage in a region?
To explore these questions, we analyzed data about the use of special wage certificates around the United States, and prejudice data from 4.70 million (M) people.
Methods
Subminimum Wage
Data about Section 14(c) special wage certificates were obtained from Department of Labor (2018a, 2018b, 2018c, 2018d). The Department of Labor details every employer in the nation that utilizes special wage certificates, including how many workers are paid subminimum wage under those certificates. Employers' locations were utilized to aggregate the special wage certificates by region – metropolitan statistical area (MSA). The United States Census Bureau (2016) defines an MSA as
a geographic entity delineated by the Office of Management and Budget for use by federal statistical agencies. Metropolitan statistical areas consist of the county or counties (or equivalent entities) associated with at least one urbanized area of at least 50,000 population, plus adjacent counties having a high degree of social and economic integration with the core as measured through commuting ties. (n.p.)
There were 366 MSAs and 48 nonmetropolitan areas (one nonmetropolitan for each state, excluding New Jersey and Rhode Island, which did not have nonmetropolitan areas) in the dataset. The Department of Labor data were then used to determine if each region (MSAs and nonmetropolitan areas) utilized special wage certificates (yes (1); no (0)), how many special wage certificates they used, and how many people they paid subminimum wage.
Ableism, Racism, and Sexism
There are two levels of attitudes: explicit (conscious) attitudes and implicit (unconscious) attitudes (Amodio & Mendoza, 2011; Antonak & Livneh, 2000). As people may feel pressured to conceal their biases, or may be unaware they hold biased attitudes, there are concerns that explicit measures do not capture all attitudes (Amodio & Mendoza, 2011; Antonak & Livneh, 2000). This may be especially true for topics where it is socially taboo to divulge having negative attitudes, such as against people with disabilities. For this reason, much attitude research has shifted towards examining implicit attitudes. Implicit attitudes can relate to automatic processes triggered by external cues and reflect associations between attitudes and concepts; "'implicit' refers to [lack of] awareness of how a bias influences a response, rather than to the experience of bias or to the response itself" (Amodio & Mendoza, 2011, p. 359).
One of the most prevalent methods to measure implicit attitudes is the implicit association test (IAT). The IAT examines people's associations and attitudes by measuring reaction time when items are sorted in stereotype congruent and incongruent ways; the quicker the reaction time, the stronger the association between groups and traits (Karpinski & Hilton, 2001). Scores of 0.15 to 0.34 reveal a slight preference for the social majority group, 0.35 to 0.64 a moderate preference, and 0.65 and greater a strong preference (Aaberg, 2012; Greenwald, Nosek, & Banaji, 2003). Negative values of the same values above reveal preferences for the social minority group, and scores from -0.14 to 0.14 reveal no prejudice (Aaberg, 2012; Greenwald et al., 2003).
Data about implicit ableism, racism, and sexism were obtained from Project Implicit (Xu, Nosek, & Greenwald, 2014), a database where people can test their implicit attitudes. A total of 7.60 M people from all 50 states and the District of Columbia participated in the racism IAT (Black-White IAT), 2.00 M in the sexism IAT (gender-career IAT), and 0.70 M in the ableism IAT (disability attitudes IAT) between 2002 and 2017. Of those 10.28 M total participants, half of those participants (45.9%) also completed demographic information about their residency (region). Those without this information or who lived in United States territories were removed. This resulted in a total n of 4.7 M people (ableism = 0.3 M; racism = 3.5 M; sexism = 0.9 M). There was an average of 3,798 participants per MSA (ableism M = 789; racism M = 8,461; sexism M = 2,143). Participants' residency was then used to aggregate IAT scores by region (MSA), with the MSA's mean score serving as the MSA's ableism, racism, and sexism scores.
Political Orientation
We included political orientation as a variable because of the link between conservatism, business interests, and the status quo in the United States. Research has found, not only do conservatives tend to be more favorable towards corporations than liberals, they are also more likely to favor maintaining the status quo and resist attempts to change it by rationalizing and accepting inequality (Graham, Haidt, & Nosek, 2009; Jost, Nosek, & Gosling, 2008).
Data about participants' political orientation was also obtained from the Project Implicit dataset. Participants were asked to select their political orientation on a seven-point Likert scale from strongly conservative (1) to strongly liberal (7). We followed the same procedure as with the ableism, racism, and sexism scores to create an average political orientation of each MSA using this participant data. The average political orientation per region was 4.23 (SD = 0.38) (neutral), ranging from 3.20 (slightly conservative) (Provo-Orem, UT) to 5.43 (slightly liberal) (Santa Cruz-Watsonville, CA).
Region Size
In order to examine relationships with, as well as control for, region size, each region's population was utilized as a variable. Population data was obtained from the United States Census Bureau (2018) and Kaiser Family Foundation (2017) (nonmetropolitan areas). We utilized the most recent data available (2016). The average region had a population of 755,112 people (SD = 1.52 M), ranging from 54,742 (Carson City, NV) to 20.15 M (New York-Northern New Jersey-Long Island, NY-NJ-PA).
Region Wealth
A common argument in support of subminimum wage is that companies paying subminimum wage cannot afford to pay people minimum wage or above (Whittaker, 2005). Thus, regional wealth was used as a variable. Regional total personal income was used to represent regional wealth. Total personal income is:
…the income received by, or on behalf of, all persons from all sources: from participation as laborers in production, from owning a home or business, from the ownership of financial assets, and from government and business in the form of transfers. It includes income from domestic sources as well as the rest of the world. It does not include realized or unrealized capital gains or losses. (Bureau of Economic Analysis, 2016, n.p.)
Personal income for each of the regions was obtained from the United States Bureau of Economic Analysis (2018). Data from 2016 was utilized as it was the latest available. The average personal income per MSA was $75.14 M (SD = 159.04), ranging from $2.23 M (Carson City, NV) to $1,193.45 M (TX nonmetropolitan area).
Analysis
This study had three research questions. The first question was: How do ableism, racism, sexism, population size, wealth, and political orientation impact if special wage certificates are used in a region? To explore this research question, a binary logistic regression was utilized with the dependent variable (DV) use of special wage certificates (yes (1); no (0)). The independent variables (IVs) included the following: ableism; racism; sexism; political orientation; region wealth (personal income in M); and, population (in 100,000).
The second research question was: How do ableism, racism, sexism, population size, wealth, and political orientation impact how many subminimum wage certificates are used in a region? We ran a multiple linear regression to determine correlates of the number of special wage certificates used in a region per capita (per 100,000) (DV). The IVs included: ableism; racism; sexism; political orientation; and, region wealth (personal income in M). We also controlled for region size by embedding the population into the DV – per capita calculation – to minimize collinearity.
The third research question was: How do ableism, racism, sexism, population size, wealth, and political orientation impact how many people are paid subminimum wage in a region? To explore this research question, a multiple linear regression was utilized. The DV was the number of people paid subminimum wage per 100,000 people in the region; per capita calculations (people paid subminimum wage divided by region population in 100,000) were used to control for region size and minimize collinearity. The IVs were: ableism; racism; sexism; political orientation; and, wealth (personal income in M).
Results
Approximately three-quarters (76.8%, n = 318) of the regions used special wage certificates. A total of 1,600 certificates were used across the regions, with an average of 3.86 certificates (SD = 6.82) used per region. The number of certificates per region ranged from 0 (96 regions) to 50 (New York-Northern New Jersey-Long Island, NY-NJ-PA). A total of 141,081 people across the nation were paid subminimum wage via special wage certificates. The number of people paid subminimum wage per region ranged from 0 (96 regions) to 5,143 (New York-Northern New Jersey-Long Island, NY-NJ-PA), with an average of 340.78 people (SD = 652.17) per region paid subminimum wage.
Implicit ableism ranged from 0.33 (moderate prejudice) (Casper, WY) to 0.71 (strong prejudice) (Pine Bluff, AR). The average implicit ableism score was 0.50 (SD = 0.04), which is moderate prejudice. The average implicit racism score was 0.33 (SD = 0.04), which is moderate prejudice. Implicit racism ranged from 0.14 (no prejudice) (Albany, GA; Pine Bluff, AR) to 0.41 (moderate prejudice) (Bay City, MI; Fond du Lac, WI). The average implicit sexism score was 0.39 (SD = 0.03), which is moderate prejudice. Implicit sexism ranged from 0.30 (slight prejudice) (Clarksville, TN-KY; Midland, TX; MA nonmetropolitan area) to 0.48 (moderate prejudice) (Jackson, TN; Longview, TX).
Utilization of Special Wage Certificates
We ran a logistic regression to determine what factors (IVs: ableism, racism, sexism, political orientation, personal income (M), population (100,000)) impacted if a region utilized special wage certificates (DV: use of special wage certificates). The model was significant, χ2(6) = 53.59, -2LL = 366.66, p < .001. The model correctly categorized 77.2% of cases and predicted 19.2% of variance (Nagelkerke R2).
| Variable | B | S.E. | Wald | df | Odds ratio | 95% confidence interval | |
|---|---|---|---|---|---|---|---|
| Ableism | 2.94 | 2.61 | 1.27 | 1.00 | 18.93 | 0.11 | 3,141.49 |
| Racism | 5.33 | 3.20 | 2.78 | 1.00 | 207.05 | 0.39 | 109,859.04 |
| Sexism | -1.52 | 4.68 | 0.10 | 1.00 | 0.22 | 0.00002 | 2136.58 |
| Political orientation | -0.25 | 0.35 | 0.54 | 1.00 | 0.78 | 0.39 | 1.53 |
| Population (in 100,000)*** | 0.26 | 0.07 | 14.32 | 1.00 | 1.30 | 1.13 | 1.48 |
| Personal Income (M) | 0.00 | 0.00 | 0.00 | 1.00 | 1.00 | 0.99 | 1.01 |
| Constant | -1.34 | 3.38 | 0.16 | 1.00 | 0.26 | ||
Note. *p<.05. **p<.01. ***p<.001.
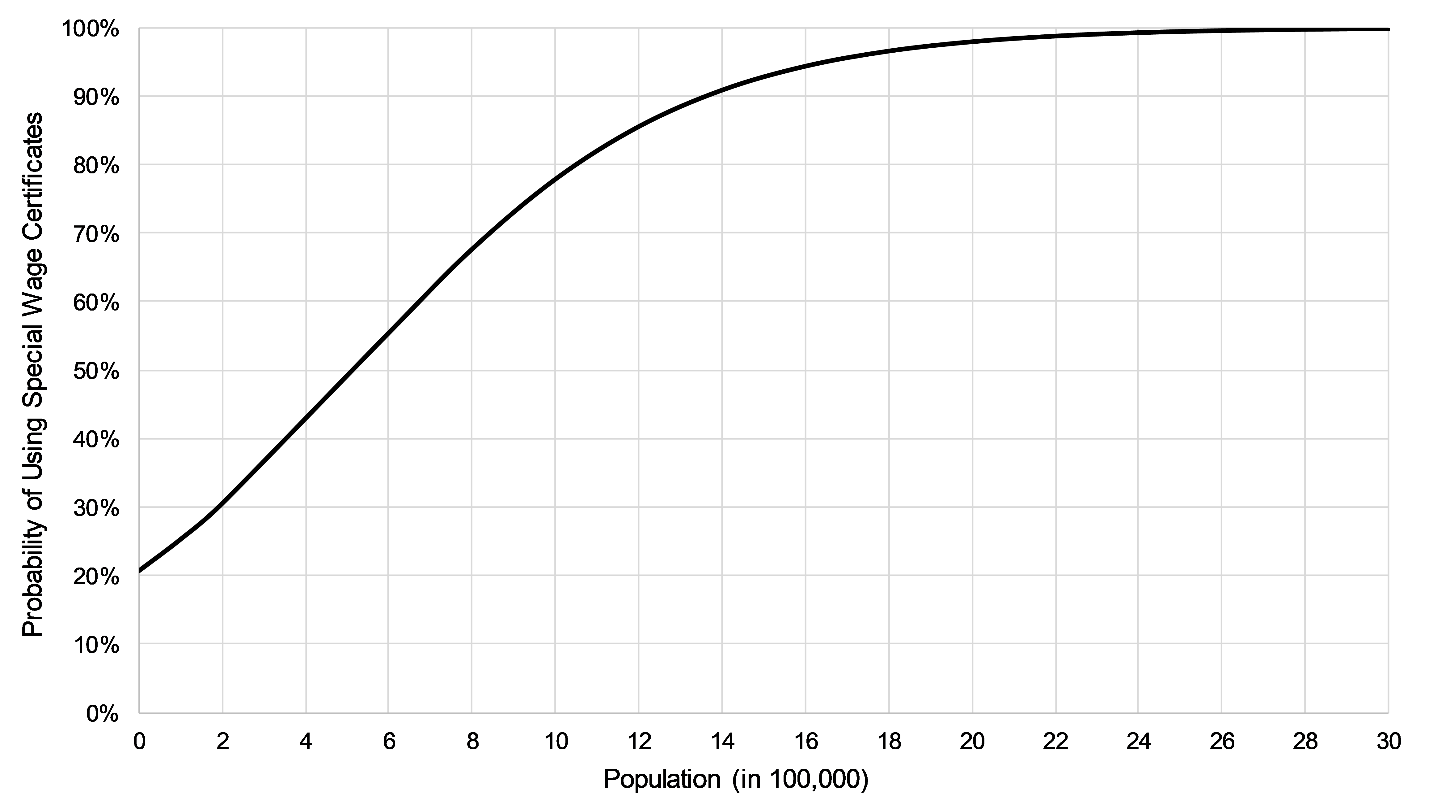
Figure 1. The probability of a region using special wage certificates based on their size (in 100,000). The figure shows that as the population increases, so does the probability of using special wage certificates. The curve of the line showing the relationship is positive, but increases at a sharper rate in the beginning and then begins to level out towards the end of the line.
According to univariate statistics, population was significant (p < 0.001) (Table 1). Controlling for all other variables, the larger the region, the more likely they were to utilize special wage certificates (figure 1). For example, a region with 100,000 residents has a 25.4% probability of utilizing special wage certificates. In comparison, a region with 1 M residents has a 77.9% probability of utilizing special wage certificates.
Number of Special Wage Certificates Utilized
We ran a multiple linear regression to determine correlates of the number of special wage certificates used in a region per capita (per 100,000) (DV). The IVs included ableism, racism, sexism, political orientation, and state wealth. We also controlled for region size by embedding the population into the DV (per capita calculation). The model was significant, F(5, 380) = 3.79, p = 0.002, R2 = 0.047. Racism was significant at t = 2.53, p = 0.012 (Table 2). Wealth (personal income; M) was also significant at t = 2.08, p = 0.038. The more racist a region, the more special wage certificates they utilized (figure 2). For example, two regions of the same average size (755,111), political orientation (4.23), wealth (75.14 M), ableism (0.50), and sexism (0.39) but with different levels of racism (0.35 versus 0.45) are expected to utilize 0.74 and 1.00 subminimum certificates per 100,000 people in the region respectively.
| Variable | B | S.E. | t | 95% confidence interval | |
|---|---|---|---|---|---|
| (Constant) | -0.38 | 1.10 | -0.34 | -2.55 | 1.79 |
| Ableism | 0.69 | 0.88 | 0.78 | -1.04 | 2.42 |
| Racism* | 2.61 | 1.03 | 2.53 | 0.58 | 4.64 |
| Sexism | 1.67 | 1.57 | 1.06 | -1.42 | 4.77 |
| Political orientation | -0.20 | 0.11 | -1.80 | -0.41 | 0.02 |
| Personal income (M)* | 0.0005 | 0.0003 | 2.08 | 0.00003 | 0.001 |
Note. *p<.05. **p<.01. ***p<.001.
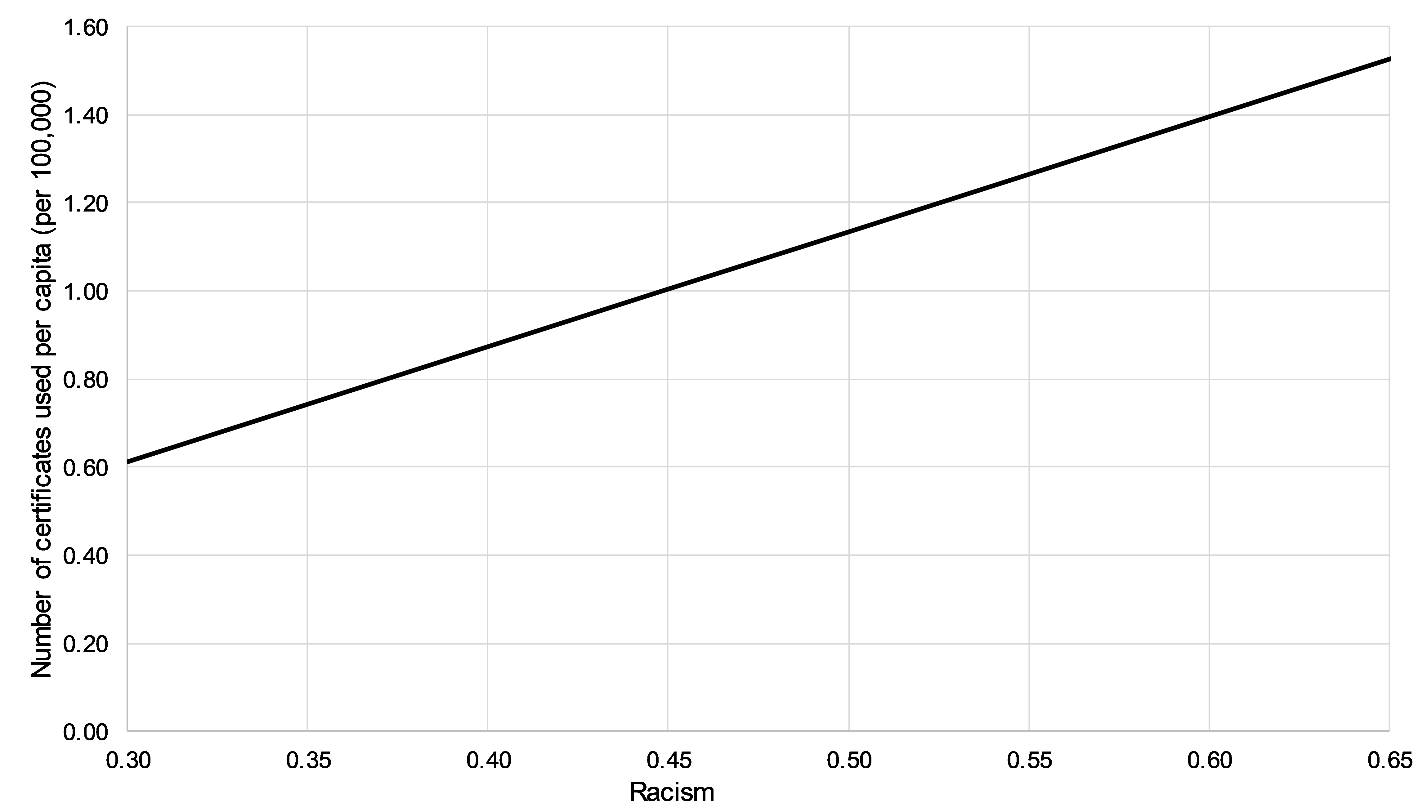
Figure 2. The relationship between racism and the number of special wage certificates used per 100,000 residents in a region. The figure shows a positive linear relationship between racism and the number of certificates used per capita (per 100,000) – as the level of racism increases, more certificates are likely to be used per capita.
Moreover, the more the region's wealth, the more special wage certificates they utilized (figure 3). For example, two regions of the same average size (755,111), political orientation (4.23), ableism (0.50), racism (0.33), and sexism (0.39) but with different levels of wealth (100 M versus 500 M) are expected to utilize 0.70 and 0.92 subminimum certificates per 100,000 people in the region respectively.
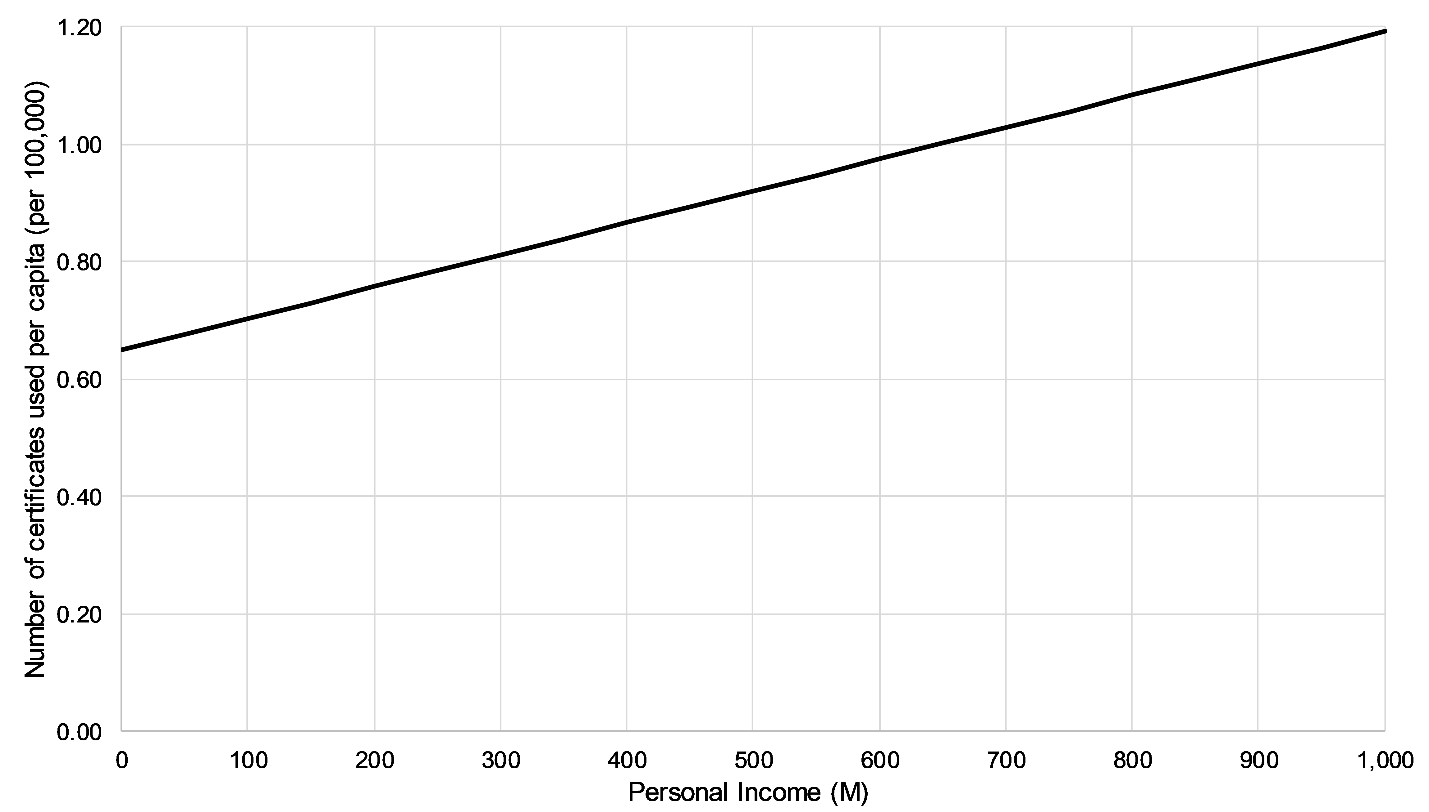
Figure 3. The relationship between personal income in millions and the number of special wage certificates used per 100,000 residents in a region. The figure shows a positive linear relationship between the region's personal income in millions and the number of certificates used per capita (per 100,000). According to the figure, as the personal income gets larger, so does the number of certificates used per capita.
Number of People Paid Subminimum Wage
To examine which factors impact the number of people paid subminimum wage in a region, we also ran a linear regression model between the number of people paid subminimum wage in the region per capita (per 100,000 people) (DV) and ableism, racism, sexism, political orientation, and wealth (IVs). The model was significant, F(5, 380) = 4.26, p = < 0.001, R2 = 0.053. The ableism score was significant at t = 2.56, p = 0.011 (Table 3). The racism score was also significant at t = 3.79, p <; 0.001.
| Variable | B | S.E. | t | 95% confidence interval | |
|---|---|---|---|---|---|
| (Constant) | -189.88 | 93.17 | -2.04 | -373.08 | -6.68 |
| Ableism* | 190.22 | 74.25 | 2.56 | 44.23 | 336.22 |
| Racism*** | 330.51 | 87.13 | 3.79 | 159.19 | 501.82 |
| Sexism | 132.41 | 132.86 | 1.00 | -128.82 | 393.64 |
| Political orientation | -2.16 | 9.17 | -0.24 | -20.18 | 15.87 |
| Personal Income (M) | 0.01 | 0.02 | 0.24 | -0.04 | 0.05 |
Note. *p<.05. **p<.01. ***p<.001.
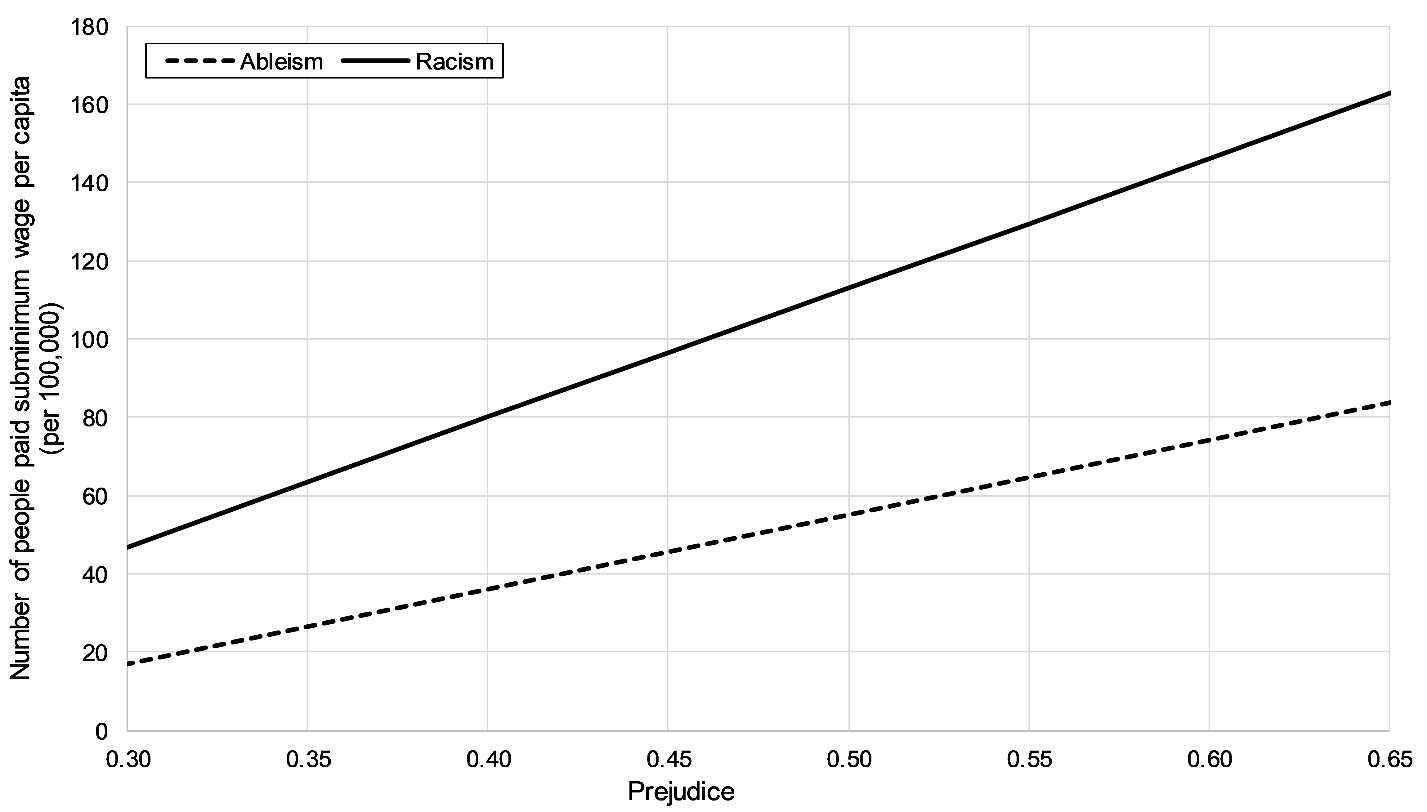
Figure 4. The relationship between ableism and racism, and the number of people paid subminimum wage per 100,000 residents in a region. The figure shows two positive linear relationships, one for ableism and one for racism. For both ableism and racism, as the level of prejudice gets higher, the number of people paid subminimum wage per capita (per 100,000) also increases. The line indicating the relationship between racism and the number of people paid subminimum wage per capita increases at a slightly quicker rate than the line for ableism and the number of people paid subminimum wage per capita.
According to the model, the more ableist and racist a region, the more people that will be paid with subminimum wage (figure 4). For example, two regions of the same average size (755,111), political orientation (4.23), wealth (75.14 M), racism (0.33), and sexism (0.39) but with different levels of ableism (0.35 versus 0.45) are expected to pay 26.66 and 45.68 people subminimum wage per 100,000 people in the region respectively. Moreover, two regions of the same average size (755,111), political orientation (4.23), personal income (75.14 M), ableism (0.50) and sexism (0.39) but with different levels of racism (0.35 versus 0.45) are expected to pay 63.43 and 96.48 people subminimum wage per 100,000 people in the region respectively.
Discussion
Subminimum wage is a prominent and problematic issue affecting the lives of many people with disabilities in the United States. For these reasons, the aim of this study was to explore factors impacting the use of special wage certificates and subminimum wage across the United States. Our findings revealed a significant relationship between the use of special wage certificates and population size. This finding may be related to service systems in rural and urban areas. Larger regions may have more service providers, and as a result, more sheltered workshops; meanwhile, less populated areas may have fewer services and/or providers in general, resulting in fewer opportunities to work in sheltered settings or work in general. Moreover, because of low expectations regarding people with disabilities' abilities, many subminimum wage jobs often focus on manufacturing, such as packaging or parts assembly, or janitorial services (Quigley, Jennifer. 2018. Interview with author, July 9). As such, there may also be an interaction regarding population size with the industry types in different settings.
In addition, according to our findings, wealthier regions – those with higher personal income – utilize more special wage certificates, regardless of the size (population) of the region. This finding runs counter to the pro-subminimum wage argument that companies cannot afford to pay people with disabilities federal or state minimum wages, as well as claims that subminimum wage floors are a "unnecessary burden on the employers" because they require too many administrative tasks (Whittaker, 2005, p. 26). More research is needed to determine why wealthier regions of the United States utilize more subminimum wage certificates, and if this increased wealth is associated with profiting off cheap labor – subminimum wage – especially as people with disabilities can be paid subminimum wage for doing the same tasks as nondisabled people (Elk, 2013).
Our findings also revealed significant links between subminimum wage and prejudice. While subminimum wage in its essence is based on stereotypes about disability, the relationship with racism may seem less apparent. However, our findings revealed racism is a factor in use of subminimum wage certificates to the same degree, if not more, than ableism. The intertwining of ableism, racism, and subminimum wage is related to the long history of ableism and racism in the United States, particularly when it comes to employment. For example, the unemployment rate of people of color and people with disabilities is consistently higher than that of White and nondisabled people (Bureau of Labor Statistics, 2018a, 2018b). Moreover, there is still a large wage gap between White nondisabled men and people of color, people with disabilities, and women (National Women's Law Center, 2017). This intertwining is also related to current ideology about 'hard work' and 'fairness'.
In the United States, many prejudiced people believe discrimination is no longer relevant. For example, many White people believe that Black people do not lose out on opportunities because of their race. Prejudiced people also commonly believe discrimination is no longer a serious issue, and as a result, social minorities are getting 'special treatment' (Henry & Sears, 2002; McConahay & Hough, 1976; Sears & McConahay, 1973; Sears & Henry, 2003; Sears, Henry, & Kosterman, 2000). In fact, regions in this study where more people believed that corporations are already fair to Black people were more likely to utilize certificates. Because they believe discrimination is no longer an issue, these types of prejudiced people tend to also believe that social minorities are unwilling to take responsibility for their lives (Henry & Sears, 2002; McConahay & Hough, 1976; Sears & McConahay, 1973; Sears & Henry, 2003; Sears et al., 2000).
The idea that people need to 'pull themselves up by the bootstraps' – individualism – is an embraced ideology in the United States. Individualism relies both on the idea of a Protestant work ethic narrative, wherein people have direct responsibility for their own outcomes, as well as a just-world ideology, wherein people are rewarded for their actions. Placing the onus on the individual not only blames discriminated groups for their status – and in this case justifies that they deserve subminimum wage – but also denies the continuing discrimination they face.
This idea that people receive what they deserve is particularly problematic as majority group members rarely believe that social minorities, such as people of color and/or with disabilities, are more skilled than they are. For example, research has found many White people describe Black people as significantly less intelligent than themselves, even when they are explicitly told by researchers that a Black peer in the study was of higher ability than themselves; in fact, in this study, it was hard for the White participants to acknowledge that their Black peer was equal in intelligence to themselves, let alone had a higher intelligence (Dovidio & Gaertner, 1981; Gaertner & Dovidio, 1986). A similar phenomenon may be operating related to subminimum wage – people may believe subminimum wage recipients have much lower skillsets than themselves, thereby justifying this discrimination.
It should also be noted that although there was not a statically significant difference in prejudice between regions that used special wage certificates and those that did not, this does not mean the use of certificates is prejudice-free. In fact, the overwhelming majority of regions scored as ableist, racist, and sexist, regardless of if they utilized certificates or not.
Although we also found no relationship between regions' political orientation and their use of subminimum wage, because of the link between conservativism and favoritism towards corporations, there may be interactions at play that should be explored via future research. While the findings of this study related to political orientation could relate to how regions' political orientation was calculated based on the Project Implicit participants, the lack of significant differences may also relate to the embracing of capitalism by both conservatives and liberals in the United States, as well as the tendency of both to be ableist, racist, and sexist (Dovidio, 2001; Dovidio & Gaertner, 2008; Friedman, 2016; Henry & Sears, 2002). More research is needed to tease out these relationships.
Limitations
When interpreting these findings, it should be noted that people volunteered to participate in the prejudice IATs and, therefore, there is a chance of selection bias. It should also be noted that this was a secondary data analysis and we did not have the ability to ask the participants additional questions. Moreover, we did not explore interactions. It should also be noted our aim was not to examine all potential factors related to subminimum wage.
Conclusion
Subminimum wage hinges on stereotypes about ability and productivity. This study was one of the first of its kind to examine the relationship between subminimum wage and prejudice, revealing a quantitative link between the use of subminimum wage practices, and racism and ableism. This study adds to decades of research, including from the Department of Labor and other government agencies (Whittaker, 2005), as well as calls from advocates with disabilities, highlighting that subminimum wage practices are discriminatory. Since focus on disability is often about how it affects potential workers, normalizing disability oppression helps maintain existing structures of work (Abberley, 1987; Barnes, 1997). These practices must be dismantled in order to end the unjust treatment of people with disabilities.
References
- Aaberg, V. A. (2012). A path to greater inclusivity through understanding implicit attitudes toward disability. The Journal of nursing education, 51(9), 505-510. https://doi.org/10.3928/01484834-20120706-02
- Abberley, P. (1987). The concept of oppression and the development of a social theory of disability. Disability, Handicap & Society, 2(1), 5-19. https://doi.org/10.1080/02674648766780021
- Americans With Disabilities Act of 1990, Pub. L. No. 101-336, 104 Stat. 328, (1990).
- Amodio, D. M., & Mendoza, S. A. (2011). Implicit intergroup bias: cognitive, affective, and motivational underpinnings. In B. Gawronski & B. K. Payne (Eds.), Handbook of implicit social cognition: Measurement, theory, and applications (pp. 353-374). New York City: Guilford Press.
- Annamma, S. A., Connor, D., & Ferri, B. (2013). Dis/ability critical race studies (DisCrit): Theorizing at the intersections of race and dis/ability. Race Ethnicity and Education, 16(1), 1-31. https://doi.org/10.1080/13613324.2012.730511
- Antonak, R., & Livneh, H. (2000). Measurement of attitudes towards persons with disabilities. Disability and Rehabilitation, 22(5), 211-224. https://doi.org/10.1080/096382800296782
- Barnes, C. (1997). A legacy of oppression: A history of disability in Western culture. In L. Baron & M. Oliver (Eds.), Disability studies: Past, present and future (pp. 3-24). Leeds: The Disability Press.
- Beckert, S., & Rockman, S. (2016). Slavery's capitalism: A new history of American economic development. Philadelphia: University of Pennsylvania Press. https://doi.org/10.9783/9780812293098
- Bell, C. (2006). Introducing White disability studies: A modest proposal. The disability studies reader, 2, 275-282
- Bureau of Economic Analysis. (2016). Personal income and outlays, July 2016 [Press release]. Retrieved from http://www.bea.gov/newsreleases/national/pi/pinewsrelease.htm
- Bureau of Economic Analysis. (2018). Personal income and outlays, May 17 [Press release]. Retrieved from https://www.bea.gov/iTable/iTable.cfm?reqid=70&step=1&isuri=1&acrdn=8#reqid=70&step=1&isuri=1&7022=100&7040=-1&7023=8&7024=non-industry&7033=-1&7025=5&7026=xx&7001=8100&7027=2016&7028=1&7083=levels&7029=103&7090=70&7031=5
- Bureau of Labor Statistics. (2018a). Household data not seasonally adjusted quarterly averages e-16. Unemployment rates by age, sex, race, and hispanic or latino ethnicity. Retrieved from https://www.bls.gov/web/empsit/cpsee_e16.htm
- Bureau of Labor Statistics. (2018b). Persons with a disability: Labor force characteristics summary. Retrieved from https://www.bls.gov/news.release/disabl.nr0.htm
- Butterworth, J., Hall, A., Hoff, D., & Migliore, A. (2007). State and international efforts to feform or eliminate the use of sub-minimum wage for persons with disabilities: University of Massachusetts Boston: Institute for Community Inclusion.
- Charlton, J. (1998). Nothing about us without us: Disability oppression and empowerment. Berkeley: University of California Press. https://doi.org/10.1525/california/9780520207950.001.0001
- Cimera, R. E. (2011). Supported versus sheltered employment: Cumulative costs, hours worked, and wages earned. Journal of Vocational Rehabilitation, 35, 85-92
- Civic Impulse. (2016). H.R. 3086 — 112th Congress: Fair Wages for Workers with Disabilities Act of 2011. Retrieved from https://www.govtrack.us/congress/bills/112/hr3086
- Darity, W. A., & Mason, P. L. (1998). Evidence on discrimination in employment: Codes of color, codes of gender. Journal of Economic Perspectives, 12(2), 63-90 https://doi.org/10.1257/jep.12.2.63
- Dejean, A. (2017). Many people with disabilities are being paid way below the minimum wage, and it's perfectly legal. Mother Jones. Retrieved from https://www.motherjones.com/politics/2017/08/many-people-with-disabilities-are-being-paid-way-below-the-minimum-wage-and-its-perfectly-legal/
- Department of Labor. (2018a). Businesses that hold Section 14(c) certificates as of April 1, 2018. Retrieved from https://www.dol.gov/whd/specialemployment/BusinessCertList.htm
- Department of Labor. (2018b). Community rehabilitation programs (CRPs) list as of April 1, 2018. Retrieved from https://www.dol.gov/whd/specialemployment/CRPlist.htm
- Department of Labor. (2018c). Employers of patient workers list as of April 1, 2018. Retrieved from https://www.dol.gov/whd/specialemployment/PatientWorkerList.htm
- Department of Labor. (2018d). School work experience programs (SWEPs) list as of April 1, 2018. Retrieved from https://www.dol.gov/whd/specialemployment/SWEPlist.htm
- Dovidio, J. F. (2001). On the nature of contemporary prejudice: The third wave. Journal of Social Issues, 57(4), 829-849. https://doi.org/10.1111/0022-4537.00244
- Dovidio, J. F., & Gaertner, S. L. (1981). The effects of race, status, and ability on helping behavior. Social Psychology Quarterly, 44(3), 192-203 https://doi.org/10.2307/3033833
- Dovidio, J. F., & Gaertner, S. L. (2008). New directions in aversive racism research: Persistence and pervasiveness. In C. Willis-Esqueda (Ed.), Motivational aspects of prejudice and racism (pp. 43-67). New York: Springer. https://doi.org/10.1007/978-0-387-73233-6_3
- Duggan, L. (2003). The twilight of equality?: Neoliberalism, cultural politics and the attack on democracy. Boston: Beacon Press.
- Elk, M. (2013). Top Democrats differ on ending subminimum wage for workers with disabilities. In These Times. Retrieved from http://inthesetimes.com/working/entry/14697/top_democrats_differ_on_ending_subminimum_wage_for_workers_disabilities/
- Erevelles, N. (2011). Disability and difference in global contexts. New York: Springer. https://doi.org/10.1057/9781137001184
- Erevelles, N., & Minear, A. (2010). Unspeakable offenses: Untangling race and disability in discourses of intersectionality. Journal of Literary & Cultural Disability Studies, 4(2), 127-145. https://doi.org/10.3828/jlcds.2010.11
- Friedman, C. (2016). Aversive ableism: Subtle prejudice and discrimination towards disabled people (Doctoral dissertation). University of Illinois at Chicago, Chicago. Retrieved from http://hdl.handle.net/10027/20940
- Gaertner, S. L., & Dovidio, J. F. (1986). The aversive form of racism. In S. L. Gaertner & J. F. Dovidio (Eds.), Prejudice, discrimination, and racism: Theory and research (pp. 61-89). Orlando: Academic Press.
- Garland-Thomson, R. (2005). Feminist Disability Studies. Signs: Journal of Women in Culture and Society, 30(2), 1557-1587 https://doi.org/10.1086/423352
- Graham, J., Haidt, J., & Nosek, B. A. (2009). Liberals and conservatives rely on different sets of moral foundations. Journal of Personality and Social Psychology, 96(5), 1029 https://doi.org/10.1037/a0015141
- Greenwald, A. G., Nosek, B. A., & Banaji, M. R. (2003). Understanding and using the implicit association test: I. an improved scoring algorithm. Journal of Personality and Social Psychology, 85(12), 197-216 https://doi.org/10.1037/0022-3514.85.2.197
- Henry, P. J., & Sears, D. O. (2002). The Symbolic Racism 2000 Scale. Political Psychology, 23(2), 253-283. https://doi.org/10.1111/0162-895X.00281
- Hughes, B., McKie, L., Hopkins, D., & Watson, N. (2005). Love's labours lost? Feminism, the disabled people's movement and an ethic of care. Sociology, 39(2), 259-275 https://doi.org/10.1177/0038038505050538
- Jost, J. T., Nosek, B. A., & Gosling, S. D. (2008). Ideology: Its resurgence in social, personality, and political psychology. Perspectives on Psychological Science, 3(2), 126-136 https://doi.org/10.1111/j.1745-6916.2008.00070.x
- Kaiser Family Foundation. (2017). Population distribution by metropolitan status (2016). Retrieved from https://www.kff.org/other/state-indicator/metropolitan-distribution/?dataView=1¤tTimeframe=0&selectedDistributions=nonmetropolitan&sortModel=%7B%22colId%22:%22Location%22,%22sort%22:%22asc%22%7D
- Karpinski, A., & Hilton, J. L. (2001). Attitudes and the Implicit Association Test. Journal of Personality and Social Psychology, 81(5), 774-788. https://doi.org/10.1037/0022-3514.81.5.774
- Kumari-Campbell, F. (2009). Contours of ableism: The production of disability and abledness. London: Palgrave MacMillan. https://doi.org/10.1057/9780230245181
- Madrigal, B. (2011). Statement of Endorsement by: Barbara Madrigal. Retrieved from http://www.ncsab.org/alert/2011/statement_of_endorsement_.htm
- Maurer, M. (2011). The Fair Wages for Workers with Disabilities Act of 2011 H.R. 3086. Retrieved from https://nfb.org/images/nfb/documents/pdf/fair-wagesforworkers-2012.pdf
- McConahay, J. B., & Hough, J. C. (1976). Symbolic racism. Journal of Social Issues, 32(2), 23-45. https://doi.org/10.1111/j.1540-4560.1976.tb02493.x
- National Disability Rights Network. (2011). Segregated and exploited: The failure of the disability system to provide quality work. Washington, D.C.: National Disability Rights Network.
- National Women's Law Center. (2017). The wage gap: The who, how, why, and what to do. Retrieved from https://nwlc-ciw49tixgw5lbab.stackpathdns.com/wp-content/uploads/2016/09/The-Wage-Gap-The-Who-How-Why-and-What-to-Do-2017-2.pdf
- O'Leary, M. E. (2017). Cripping care for individuals with psychiatric disability: Looking beyond self-determination frameworks to address treatment and recovery. Review of Disability Studies: An International Journal, 13(4)
- O'Toole, C. (2013). Disclosing our relationships to disabilities: An invitation for disability studies scholars. Disability Studies Quarterly, 33(2). https://doi.org/10.18061/dsq.v33i2.3708
- Pager, D., & Shepherd, H. (2008). The sociology of discrimination: Racial discrimination in employment, housing, credit, and consumer markets. Annu. Rev. Sociol, 34, 181-209 https://doi.org/10.1146/annurev.soc.33.040406.131740
- Quillian, L., Pager, D., Hexel, O., & Midtbøen, A. H. (2017). Meta-analysis of field experiments shows no change in racial discrimination in hiring over time. Proceedings of the National Academy of Sciences, 114(41), 10870-10875 https://doi.org/10.1073/pnas.1706255114
- Reskin, B. F. (1988). Bringing the men back in: Sex differentiation and the devaluation of women's work. Gender & Society, 2(1), 58-81 https://doi.org/10.1177/089124388002001005
- Rogan, P., & Rinne, S. (2011). National call for organizational change from sheltered to integrated employment. Intellectual and Developmental Disabilities, 49(4), 248-260 https://doi.org/10.1352/1934-9556-49.4.248
- Sears, D., & McConahay, J. B. (1973). The politics of violence: The new urban Blacks and the Watts riot. Boston: Houghton Mifflin.
- Sears, D. O., & Henry, P. J. (2003). The origins of symbolic racism. Journal of Personality and Social Psychology, 85(2), 259-275. https://doi.org/10.1037/0022-3514.85.2.259
- Sears, D. O., Henry, P. J., & Kosterman, R. (2000). Egalitarian values and the origins of contemporary American racism. In D. O. Sears, J. Sidanius, & L. Bobo (Eds.), Racialized politics: The debate about racism in America (pp. 75-117). Chicago: University of Chicago Press.
- Taylor, S. (2004). The right not to work: Power and disability. MONTHLY REVIEW-NEW YORK-, 55(10), 30-31 https://doi.org/10.14452/MR-055-10-2004-03_2
- United Nations. (1948). Universal declaration of human rights (217 [III] A). Paris: Author.
- United Nations. (2006). Convention on the Rights of People with Disabilities. Retrieved from https://www.un.org/development/desa/disabilities/convention-on-the-rights-of-persons-with-disabilities.html
- United States Census Bureau. (2016). Metropolitan and micropolitan. Retrieved from https://www.census.gov/programs-surveys/metro-micro/about/glossary.html
- United States Census Bureau. (2018). Total metro and micro statistical areas. Retrieved from https://www.census.gov/data/tables/2016/demo/popest/total-metro-and-micro-statistical-areas.html#ds
- Whittaker, W. G. (2005). Treatment of workers with disabilities under section 14 (c) of the Fair Labor Standards Act (RL30674). Retrieved from https://digitalcommons.ilr.cornell.edu/cgi/viewcontent.cgi?referer=&httpsredir=1&article=1211&context=key_workplace
- Xu, K., Nosek, B., & Greenwald, A. (2014). Psychology data from the race implicit association test on the project implicit demo website. Journal of Open Psychology Data, 2(1), e1-e3. https://doi.org/10.5334/jopd.ac
- Yearby, R. (n.d.). The impact of structural racism in employment and wages on minority women's health. Retrieved from https://www.americanbar.org/groups/crsj/publications/human_rights_magazine_home/the-state-of-healthcare-in-the-united-states/minority-womens-health/
