Historically, disproportionality has long been documented in high incidence disability identification in K-12 education settings, and the incidence of certain psychological disorders appears uneven in educational settings and general populations (Blanchett, 2006; Coutinho, Oswald, & Best, 2002; Diala & Muntaner, 2003; Froehlich et al., 2007; Kunen, Niederhauser, Smith, Morris, & Marx, 2005; McLaughlin, Hilt, & Nolen-Hoeksema, 2007; National Research Council [NRC], 2002; Paxton, Valois, Watkins, Huebner, & Drane, 2007; Roberts, Roberts, & Xing, 2007; Skiba, Simmons, et al., 2006, Office of Civil Rights [OCR], 2008). Race/ethnicity is a measurable demographic factor that helps identify disproportionality; however, other demographic and causal factors are more difficult to define, identify, and monitor (Artiles, Arguirre-Munoz, & Abedi, 1998; Coutino et al., 2002; Kendall & Hatton, 2002; Paxton et al., 2007; Reid & Knight, 2006; Skiba, Simmons, et al., 2006; OCR, 2008). The seminal work by Dunn (1968) ushered in an age of monitoring and attempting to rectify disparities in race/ethnicity in the identification of disabilities in K-12 education. However, there is scant exploration concerning these students with disabilities in the postsecondary education setting (Reid & Knight, 2006). The K-12 disproportionate rates of identifying high incidence disabilities such as learning disabilities (LD), Attention Deficit/Hyperactivity Disorder (AD/HD), and psychological disorders among others converge in postsecondary education, where enrollment and persistence/graduation rates exhibit other demographic trends in disproportionality (Horn & Berger, 2004; U.S. Census Bureau, 2007). The investigation into how these forms of disproportionality impact the identification, access to accommodations/services, and persistence of postsecondary students with disabilities may yield answers about the impact, validity, and cost-benefit ratio of disability identification at all educational levels.
Disproportionality in the Identification of Disabilities in K-12 Education
A host of factors including the astounding growth rate of LD identification has complicated efforts to monitor and rectify disproportionality in K-12 education; however, disproportionality within race/ethnicity groups has been consistently documented in the category of LD (Coutinho et al., 2002; NRC, 2002; Skiba, Simmons et al., 2006; OCR, 2008). The most recent national data available from the OCR (2008) in the U.S. Department of Education from 2006-2007 on prevalence of LD in K-12 is presented in Table 1. American Indian/Native Alaskan students are overrepresented while Asian/Pacific Islander students are underrepresented in the category of LD. The overall rate and variability among the ethnicity/race categories were comparable to the OCR data from 1998-1999 and 2004-2005 (Coutinho et al., 2002; OCR, 2007; OCR, 2008). It is noteworthy that African-American students, while not significantly overrepresented in the LD category, have the highest percentage of identification for special education services due to overrepresentation in the categories of mental retardation and emotional disturbance (NRC, 2002; OCR 2008). Additionally, African-American students are also overrepresented in more restrictive special education service environments as compared to other students with similar disabilities (Skiba, Poloni-Staudinger, Gallini, Simmons, & Feggins-Azziz, 2006).
Similarly to LD, AD/HD is a high incidence disability that can impact academic performance. However, not all students with AD/HD symptoms are consistently diagnosed or receive remediation services through K-12 special education services. Therefore, data is incomplete concerning the prevalence of AD/HD in terms of K-12 education settings. Fortunately, a sizable and stratified national sampling of children age 8 to 15 was recently compiled (Froehlich et al., 2007). This national sampling, which was accomplished through phone interviews with caregivers concerning the existence of AD/HD symptoms, revealed disparities in regard to race/ethnicity categories. Froehlich et al. (2007) found that Mexican American and other race/ethnicity children met DSM-IV criteria for AD/HD at lower rates than African-American and Caucasian children (refer to Table 1 for prevalence rates).
Another high incidence category of disability in K-12 is emotional disturbance, which encompasses a broad spectrum of severe emotional, behavioral, and psychological disorders. Race/ethnicity disparities also exist within this K-12 disability category (refer to Table 1 for prevalence rates). Prevalence rates for race/ethnicity categories showed that African-American students were twice as likely to be identified as emotionally disturbed as Caucasian students (OCR, 2008).
Conversely, other research has suggested different trends in disproportionality in the prevalence of common psychological disorders such as anxiety and depression. There is some evidence that Hispanic/Latino adolescents, particularly Hispanic/Latina female adolescents, report higher levels of depression and anxiety than other groups (McLaughlin et al., 2007; Paxton et al., 2007). Some studies have found that African-Americans were less likely to report mood disorders and were underdiagnosed with psychological disorders (Diala & Muntaner, 2003; Kunen et al., 2005). McLaughlin et al. (2007) found that African-American adolescent males reported significantly higher levels of internalizing and externalizing symptoms than any other group besides Hispanic/Latina adolescent females.
Many factors have been linked to the disproportionality in K-12 settings. Geographic location, neighborhood/housing stability, home environment, family health care, biological factors, social-emotional environmental factors, parent participation, instruction mode, curriculum, lack of cultural responsiveness in teacher preparation, race/ethnicity of teachers, general education resource inequity, regional variation of cultural responsiveness, and special education processes have all been proposed to explain the disproportionality in special education (Durodye, Combes, & Bryant, 2004; Gregg, 2007; Harrison, 2003; Harry, 2008; Hosp & Reschly, 2004; McDonald, Keys, & Balcazar, 2007; O'Conner & Fernandez, 2006; Skiba, Simmons et al., 2006; Zhang & Katsiyannis, 2002). Coutinho et al. (2002) found that factors including student-teacher ratio, per-pupil expenditure, median housing value, household income, poverty, at-risk groups, percentage of non-Caucasian students enrolled, and percentage of limited English proficient students appeared to impact certain race/ethnicity/gender groups' odds for being identified as LD in K-12 education. Poverty was found by Froehlich et al. (2007) to increase the likelihood of meeting DSM-IV criteria for AD/HD, especially the hyperactive-impulsive type. Kendall and Hatton (2002) suggest that racism in healthcare decreases the chances minority children will be identified and treated for AD/HD compared to Caucasian children. Regarding psychological disorders, low income (or socioeconomic status), resiliency, and prior socialization have been suggested to explain disproportionality in prevalence/diagnosis (Diala & Muntaner, 2003; Kunen et al., 2005; McLaughlin et al., 2007).
The aforementioned list of factors support the argument that special education disabilities are subjective social constructions, designed to segregate minority students, particularly those living in poverty, from general education, rather than objective labels for neurological differences that cause learning problems (Harry & Klingner, 2007). This is further supported by the finding that culturally and linguistically diverse students were less likely to be identified as being disabled in school districts that have higher proportions of those culturally and linguistically diverse students (Coutinho et al., 2002). Since higher proportions of culturally and linguistically diverse students in a school district reduces disproportionality, it may be assumed that school personnel's perceptions of culturally and linguistically diverse students change if those students make up more of the student body. Furthermore, the disability determination process in K-12 education is fraught with room for error including the lack of clarity in the definitions of disabilities such as LD and emotional disturbance, variability in classroom instruction, subjective nature of determining low achievement, lack of pre-referral interventions, and inconsistency in assessment methods and instruments utilized to determine disability eligibility. Given the racial/ethnicity disproportionality, social construction argument, and margin for error in disability identification, reconsidering the disability deficit model seems warranted (Harry & Klingner, 2007). However, the special education system is unlikely to be abandoned quickly, so finding solutions to end disproportionality is still necessary.
Disproportionality in Postsecondary Education
These occurrences of disproportionality in K-12 education intersect in postsecondary education with the disparities of race/ethnicity and family income level that already exist in the postsecondary population (Horn & Berktold, 1999; Horn & Nevill, 2006; Lewis & Farris, 1999; National Center for Education Statistics [NCES], 2005). African-American, Hispanic/Latino, and low-income students have been historically underrepresented in postsecondary populations; however, there have been increases in these groups' enrollment as well as in overall enrollment in recent years (Horn & Berger, 2004).
Nationally, the enrollment of students reporting disabilities in postsecondary institutions increased from 6% in 1995-96 to 11% in 2003-04 (NCES, 1997; NCES; 2005). A chi-square analysis of the 2003-04 National Postsecondary Student Aid Study findings is presented in Table 2. The results indicated overrepresentation of "Other" race/ethnicity category students in disability categories, while Asian/Pacific Islander students were underrepresented (NCES, 2005). The trend of underrepresentation of Asian/Pacific Islander students is consistent with K-12 data provided by the OCR (Coutinho et al., 2002; OCR, 2007; OCR, 2008). Other race/ethnicity groups reporting a disability were represented at a rate commensurate with enrollment: White, non-Hispanic; Black, non-Hispanic; Hispanic; and American Indian/Alaskan Natives (NCES, 2005).
Students with disabilities were more likely to be enrolled in 2-year public postsecondary institutions than other postsecondary institutions (Horn & Berktold, 1999; Lewis & Farris, 1999). Of community college students who reported a disability in 2003-04, 21.9% reported having a mental illness/depression, 11.0% reported having an attention-related disorder, and 7.5% reported having a specific learning disability (Horn & Nevill, 2006). Trends in disproportionality regarding psychological disorders at the postsecondary level may differ from K-12 settings due to the inclusion of some behavioral disorders in the emotional disturbance special education category, as behavioral disorders are not commonly reported as disabilities by postsecondary students (Horn & Nevill, 2006).
Considering these varying types of disproportionality, the current study retrospectively investigated the age and race/ethnicity of students seen at a disability evaluation center serving thirteen two-year and four-year public postsecondary institutions (excluding technical schools) in southern Georgia between 1993 and 2007. The students presenting to the center were seeking documentation of high incidence and hidden disabilities that impact learning such as a LD, AD/HD, acquired brain injury, and/or psychological disorders in order to be granted accommodations at postsecondary institutions within the evaluation center's service area.
Given the statistics and research previously presented, the following hypotheses were generated. In terms of race/ethnicity, it was hypothesized that students would be evaluated at the center at rates commensurate with representation in the enrollment in the institutions served by the center with the exception of Native American and Asian students; the Native American students were hypothesized to be overrepresented and the Asian students were hypothesized to be underrepresented due to national trends in learning disability identification in K-12 as well as national race/ethnicity trends in declaring a disability at the postsecondary level (NCES, 2005; OCR, 2007; OCR, 2008).
Purpose of the Study
By analyzing over a thirteen-year period demographic factors of postsecondary students seeking evaluations at an evaluation center for disabilities that impact learning, trends may be identified which can help the center and similar agencies improve services for postsecondary students with disabilities by identifying groups who are not seeking evaluations and may be uninformed, underrepresented, or unable to pursue such services. Exploration of these factors may yield results applicable to other professionals involved in working with college students with disabilities, such as disability service providers, K-12 transition counselors, vocational rehabilitation counselors, adult education professionals, high school guidance counselors, and school psychologists.
Method
Data Sources and Analysis
This study consisted of 1087 undergraduate students, age 17 or older, that were evaluated for high incidence and hidden disabilities such as a learning disability, AD/HD, and/or psychological disorder at the Regents Center for Learning Disorders (RCLD) from 1993 to 2007. These students were either admitted to or attending one of thirteen public colleges or universities in southern Georgia served by the RCLD. The RCLD, one of three such centers in Georgia, offered an assessment by a licensed psychologist for a reduced fee, as compared to assessments performed by psychologists in private settings. Students were referred by the disability service providers at the institutions served by the RCLD. The students pursued this evaluation to document the existence of a disability in order to obtain accommodations in accordance with policy established by the Board of Regents of the University System of Georgia. Generally, referrals included assessment of cognitive, academic, and psychological functioning within the context of possible LD, AD/HD, acquired brain injury, or psychological disorders. Information concerning the students' age and race/ethnicity was collected at the time of each evaluation as part of the RCLD's routine data collection procedures.
The data from the 1087 students evaluated at the center from 1993 to 2007 were compared to enrollment data for the thirteen public postsecondary institutions served by the RCLD over the same time period to determine if race/ethnicity trends were consistent with the enrollment at the referring postsecondary institutions. Enrollment data over time for those institutions was available online to the public, and fall enrollment headcounts from each institution from 1993 to 2007 were used to estimate the expected proportions of the race/ethnicity of the students evaluated at the center (University System of Georgia, 2008). Race/ethnicity (African-American, Asian, Native American, Caucasian, Hispanic/Latino, and Multi-Racial) was the categorical variable.
Results
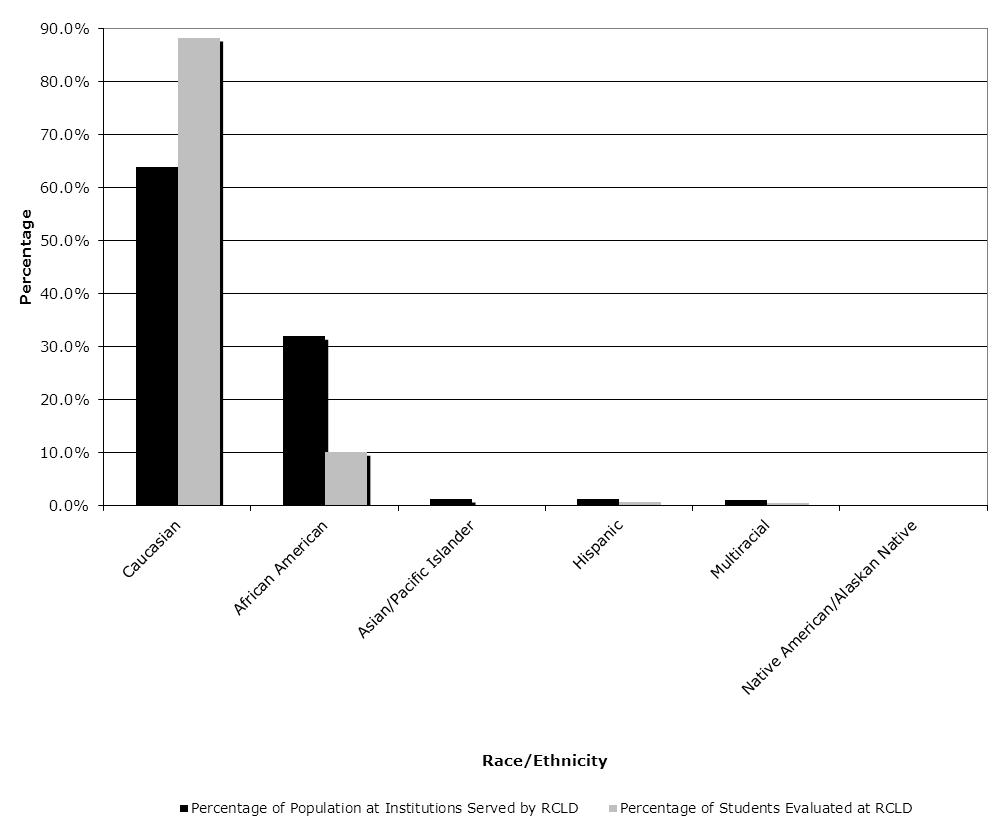
Chi-square analyses were completed for the categorical variable of race/ethnicity. The chi-square analysis of the data in Table 3 and Figure 1 shows a significant difference between the expected and observed frequencies for race/ethnicity, Χ 2 (5, N = 1087) = 274.259, p = <.001. Within the category of race/ethnicity, post-hoc chi-square tests were performed to determine which race/ethnicity groups were significantly under- or overrepresented. Caucasian students, Χ2(1, N = 960) = 106.671, p = <.001, were significantly overrepresented while African-American students, Χ2(1, N = 110) = 97.507, p = <.001, were significantly underrepresented. Asian students, (Χ2[1, N = 2] = 10.414, p = <.01, were also underrepresented. Hispanic/Latino, Native American, and Multi-Racial students were not significantly under- or overrepresented (Χ2[1, N = 9] = 1.863, p = >.05; Χ2[1, N = 1] = 2.174, p = >.05; Χ2[1, N = 5] = 3.170, p = >.05, respectively).
Discussion
As predicted from national rates of LD identification in K-12 education and reporting disabilities at the postsecondary level, Asian students were underrepresented in seeking evaluation to document a disability. Additionally, Caucasian, Hispanic/Latino, and Multi-Racial students were proportionally represented, which also supports the hypothesis. However, Native American students were proportionally represented contrary to the hypothesis that they would be overrepresented based on national rates of LD identification in K-12 and reporting disabilities at the postsecondary level. Furthermore, African-American students were significantly underrepresented, which is inconsistent with prevalence rates of LD and AD/HD as well as national rates of reporting disabilities at the postsecondary level.
Although national data trends indicate that African-American, Caucasian, Hispanic/Latino, and Native American/Native Alaskan students report having disabilities at rates commensurate with postsecondary enrollment rates according to analysis of NCES (2005) data recorded in Table 3, this study's findings that African-American students are significantly underrepresented in those seeking evaluation to document a disability at an evaluation center serving two- and four-year public postsecondary institutions in southern Georgia may be cause for concern. Because of the descriptive nature of this study, the current results offer little explanation regarding the source of this disparity. However, these findings highlight several issues concerning this disproportionality that future research should address. Previous research suggests possible causal factors for this disproportionality.
Unfortunately, despite educational and outreach efforts by postsecondary institutions, African-American students with disabilities may be unaware of the existence of or how to access the accommodations and services available due to poor communication and cooperation among secondary and postsecondary school personnel (Madaus & Shaw, 2006; National Joint Committee on Learning Disabilities, 2007; U.S. General Accounting Office [GAO], 2003). Whereas students with disabilities were actively sought, identified, and received services in K-12 through special education law, the same students with disabilities are required to seek out and provide appropriate documentation of the same disability at the postsecondary level (OCR, 2002). This shift in responsibility from school personnel to the student may be unknown or overwhelming to the student.
Although some students may be aware of the documentation requirements, they may be unable to afford the evaluations necessary to document the disability at the postsecondary level (GAO, 2003; Madaus & Shaw, 2006; Shaw, 2006). Neither secondary nor postsecondary schools are responsible for providing or paying for the evaluation necessary to document disabilities at the postsecondary level (OCR, 2002). Since the students were responsible for paying for the evaluation, which costs five hundred dollars, and the RCLD does not engage in third-party billing, it is important to note that the lack of financial means may impact a student's ability to obtain the evaluation. Governmental or educational programs, such as Vocational Rehabilitation, may be able to assist some students with disabilities with funding for the evaluations; however, these programs suffer from insufficient program capacity and/or funding, which results in waiting lists or denial of services (GAO, 2003). Lack of financial means to pursue a comprehensive evaluation may be preventing students with disabilities from receiving accommodations at the postsecondary level.
Another possible explanation for the disproportionality may be that African-American postsecondary students may not wish to seek evaluation or documentation of disabilities. In a longitudinal study tracking students with disabilities from seventh grade through post-high school outcomes, only 40.3% of the students with disabilities enrolled in postsecondary education settings reported that they had identified themselves as disabled to their schools, and 52.4% of the students with disabilities indicated that they did not consider themselves disabled (Wagner, Newman, Cameto, Garza & Levine, 2005). Anecdotally, some students seeking an evaluation at the RCLD reported that they had wanted to try college without the aid of accommodations and/or medication. Developmental tendencies and societal pressures to establish identity and independence in late adolescence and early adulthood may be especially salient factors for minority students. These factors may cause these students to refrain from documenting or reporting disabilities (McDonald et al., 2007).
These aforementioned possible barriers assume that the African-American students with disabilities transition to postsecondary education settings, and that the breakdown causing disproportionality occurs during or after that transition. Another explanation could be that African-American students with disabilities may not be successfully transitioning and matriculating to postsecondary education. Of students with disabilities, 26-29% drop out without completing high school (GAO, 2003; Wagner et al., 2005). Youth with disabilities are at risk for juvenile delinquency and criminal detention, which is further exacerbated by harsh or zero tolerance school discipline policies (National Council on Disability, 2003; Klingner et al., 2005). African-American students may have experienced inadvertent cultural bias during the special education process, leading to more restrictive placements, which may transition away from regular diploma tracks (Harry, 2008; Klingner et al., 2005). Additionally, K-12 personnel may be steering college-able minority students toward alternatives to college preparation diplomas due to their disabilities rather than an actual lack of academic ability. This possible explanation would be further complicated by the concern that some intelligence tests have been culturally-biased, which may have led to underestimations of African-American students' cognitive ability, in turn causing inappropriately low expectations for the students (Harry, 2008; Klinger et al., 2005). Harry and Klingner (2007) highlight the ways disability and social/cultural deficit views can be a significant disadvantage to minority students, and they recommend viewing these differences as variations rather than pathology.
To address disproportionality within the K-12 education system, there is at least one way in particular that the stakeholders in education can improve the special education identification and placement process, which is through improving the relationship between school personnel and culturally and linguistically diverse families. Harry, Klingner, and Hart (2005) found negative attitudes of school personnel toward African-American families living in poverty and that the school personnel had failed to discover and utilize the strengths of those families to improve educational outcomes for the children. Additionally, Harry (2008) conducted a review of literature and found that several obstacles appear to prevent the use of best practices with culturally and linguistically diverse students, including deficit views of the students' families, breakdowns in communication regarding disabilities, different cultural views of disability, and cross-cultural conflicts regarding goal setting and the caregiver's role. Harry (2008) recommends addressing this breakdown of communication through improved research about culturally and linguistically diverse families, enhanced education of teachers concerning multicultural issues, meaningful exploration of personal values of teachers, training experiences in culturally diverse schools during teacher preparation, critical analysis of special education by teachers, and preparation for teachers in cross-cultural communication.
By meaningfully engaging and educating teachers regarding cross-cultural issues, the K-12 education system may begin to view special education and culturally and linguistically diverse families differently and make necessary adjustments that could end disproportionality in disability identification. Changing perceptions and methods of communicating of school personnel appears to be a way to reduce or resolve the disproportionality problem in K-12 education. Additionally, by fostering better communication with families of culturally and linguistically diverse students, including African-Americans, educational personnel could increase the likelihood that those students' transition to postsecondary education would be smoother.
The actual explanation for the disproportionality may lie in some combination of barriers for African-American students with disabilities transitioning to and seeking documentation of their disabilities at the postsecondary level. Further investigation into the possible causal factors influencing the disproportionality identified through this study is warranted to begin to examine and address this issue.
Conclusion
The purpose of this study was to investigate trends of postsecondary students seeking evaluation to document LD, AD/HD, and/or psychological disorder. The findings indicated that African-American students were underrepresented in the group of students seeking an evaluation to document a disability. A number of possible casual factors contributing to this identified disproportionality can be hypothesized; however, further study is required to identify why African-American students are failing to submit documentation and/or seek evaluation to document a high incidence disability in public postsecondary education settings in southern Georgia.
Further quantitative and qualitative research concerning disproportionality of African-American students seeking evaluations and accommodations in postsecondary education is needed to explore the impact of several possible barriers. The communication and cooperation level between school personnel and families of African-American students is an area of major concern, as this can lead to more accurate identification of disability, less restrictive placements in special education, and improved educational outcomes for those students. Measuring the amount and effectiveness of communication and cooperation between high school and postsecondary personnel concerning transitions of students with disabilities could illuminate how this communication and cooperation could be bolstered to improve transitions. The tracking of students with disabilities could be continued into postsecondary education and employment to determine whether those students are continuing their education, seeking accommodations in postsecondary settings, and becoming successfully employed. Enrolled postsecondary students could be surveyed and/or interviewed concerning their knowledge of disability services available to them. Even with reduced fee evaluations available through the RCLD, some students may still be unable to afford the evaluation to document their disabilities. Additionally, the stigma involved with labeling at the postsecondary level provides another area in which to assess students with disabilities in postsecondary education. Researching and determining the importance of each of these barriers could provide the foundation for meaningful intervention and change.
We thank Audrey Hazamy for her assistance with manuscript preparation during this study. The data in this article were presented in "Potential Impact of Culture on Self-Identification of Minority College Students with Learning Disorders," by Amanda M. Pellegrino and Beverly M. Sermons at the 7th Annual Southeastern Conference on Cross-Cultural Issues in Counseling and Education held at the Coastal Georgia Center on February 8-9, 2008.
Correspondence concerning this article should be addressed to Amanda M. Pellegrino, Regents Center for Learning Disorders, Georgia Southern University, P.O. Box 8019, Statesboro, Georgia 30460-8019. Email: amandapellegrino@georgiasouthern.edu
Works Cited
- American Psychiatric Association. (2000). Diagnostic and Statistical Manual of Mental Disorders. (4th ed., text revision). Washington, DC: Author.
- Artiles, A.J., Aguirre-Munoz, Z., & Abedi, J. (1998). Predicting placement in learning disabilities programs: Do predictors vary by ethnic group? Exceptional Children, 64(4), 543-560.
- Blanchett, W.J. (2006). Disproportionate representation of African-American students in special education: Acknowledging the role of white privilege and racism. Educational Researcher, 35(6), 24-28.
- Coutinho, M.J., Oswald, D.P., & Best, A.M. (2002). The influence of sociodemographics and gender on the disproportionate identification of minority students as having learning disabilities. Remedial and Special Education, 23, 49-59.
- Diala, C.C., & Muntaner, C. (2003). Mood and anxiety disorders among rural, urban, and metropolitan residents in the United States. Community Mental Health Journal, 39, 239-252.
- Dunn, L.M. (1968). Special education for the mildly retarded — -Is much of it justifiable? Exceptional Children, 35, 5-22.
- Durodoye, B.A., Combes, B.H., & Bryant, R.M. (2004). Counselor intervention in the postsecondary planning of African-American students with learning disabilities. Professional School Counseling, 7(3), 133-140.
- Froehlich, T.E., Lanphear, B.P., Epstein, J.N, Barbaresi, W.J., Katusic, S.K., & Kahn, R.S. (2007). Prevalence, recognition, and treatment of Attention-Deficit/Hyperactivity Disorder in a national sample of US children, Archives of Pediatrics & Adolescent Medicine, 161, 857-864.
- Gregg, N. (2007). Underserved and unprepared: Postsecondary learning disabilities. Learning Disabilities Research and Practice, 22(4), 219-228.
- Harrison, S. (2003). Creating a successful learning environment for postsecondary students with learning disabilities: Policy and practice. Journal of College Reading and Learning, 33(2), 131-146.
- Harry, B. (2008). Collaboration with culturally and linguistically diverse families: Ideal versus reality. Exceptional Children, 74(3), 372-388.
- Harry, B. & Klingner, J. (2007). Discarding the deficit model. Educational Leadership, 64(5), 16-21.
- Harry, B. Klinger, J.K., & Hart, J. (2005). African American families under fire: Ethnographic views of family strengths. Remedial and Special Education, 26(2), 101-112.
- Horn, L., & Berger, R. (2004). College Persistence on the Rise? Changes in 5-Year Degree Completion and Postsecondary Persistence Rates Between 1994 and 2000 (NCES 2005 — 156). U.S. Department of Education, National Center for Education Statistics. Washington, DC: U.S. Government Printing Office.
- Horn, L., & Berktold, J. (1999). Students with Disabilities in Postsecondary Education: A Profile of Preparation, Participation, and Outcomes. (NCES 1999-187). U.S. Department of Education, National Center for Education Statistics. Washington, DC: U.S. Government Printing Office.
- Horn, L., & Nevill, S. (2006). Profile of Undergraduates in U.S. Postsecondary Education Institutions: 2003-04: With a Special Analysis of Community College Students (NCES 2006-184). U.S. Department of Education. Washington, DC: National Center for Education Statistics.
- Hosp, J.L., & Reschly, D.J. (2004). Disproportionate representation of minority students in special education: Academic, demographic and economic predictors. Exceptional Children, 70, 185-199.
- Kendall, J., & Hatton, D. (2002). Racism as a source of health disparity in families with children with Attention Deficit Hyperactivity Disorder. Advances in Nursing Science, 25, 22-39.
- Klingner, J., Artiles, A.J., Kozleski, E., Harry, B., Zion, S., Tate, W., et al. (2005). Addressing the disproportionate representation of culturally and linguistically diverse students in special education through culturally and linguistically diverse students in special education through culturally responsive educational systems. Education Policy Analysis Archives, 13(38). Retrieved May 28, 2008 from http://epaa.asu.edu/epaa/v13n38/.
- Kunen, S., Niederhauser, R., Smith, P.O., Morris, J.A., & Marx, B.D. (2005). Race disparities in psychiatric rates in emergency departments. Journal of Counseling and Clinical Psychology, 73, 116-126.
- Lewis, L., & Farris, E. (1999). An Institutional Perspective on Students with Disabilities in Postsecondary Education. (NCES 1999-046). U.S. Department of Education, National Center for Education Statistics. Washington, DC: U.S. Government Printing Office.
- Madaus, J.W., & Shaw, S. (2006). The impact of the IDEA 2004 on transition to college for students with learning disabilities. Learning Disabilities Research and Practice, 21(4), 273-281.
- McDonald, K.E., Keys, C.B., & Balcazar, F.E. (2007). Disability, race/ethnicity and gender: Themes of cultural oppression, acts of individual resistance. American Journal of Community Psychology, 39, 145-161.
- McLaughlin, K.A., Hilt, L.M., & Nolen-Hoeksema, S. (2007). Racial/ethnic differences in internalizing and externalizing symptoms of adolescents. Journal of Abnormal Child Psychology, 35, 801-816.
- National Center for Education Statistics. (1997). 1995-96 National Postsecondary Student Aid Study (NPSAS: 96). Washington, D.C.: United States Department of Education.
- National Center for Education Statistics (2005). 2003-04 National Postsecondary Student Aid Study (NPSAS: 04). Washington, D.C.: United States Department of Education.
- National Council on Disability. (2003, May). Addressing the needs of youth with disabilities in the juvenile justice system: The current status of evidence-based research. Washington, DC: Author. Retrieved May 28, 2008 from http://www.ncd.gov/newsroom/publications/2003/juvenile.htm.
- National Joint Committee on Learning Disabilities (2007, July). The documentation disconnect for students with learning disabilities: Improving access to postsecondary disability services. Washington, DC: Author. Retrieved on May 28, 2008 from http://www.ldonline.org/about/partners/njcld#web.
- National Research Council (2002). Minority Students in Special and Gifted Education. Committee on Minority Representation in Special Education, M. Suzanne Donovan & Christopher T. Cross, editors. Washington, DC: National Academy Press.
- O'Conner, C., & Fernandez, S.D. (2006). Race, class, and disproportionality: Reevaluating the relationship between poverty and special education placement. Educational Researcher, 35 (6), 6-11.
- Office for Civil Rights. (2002). Students with disabilities preparing for postsecondary education: Know your rights and responsibilities. Retrieved January 14, 2008 from http://www.ed.gov/about/offices/list/ocr/transition.html.
- Office for Civil Rights. (2007, May). State and National Projections for Enrollment and Selected Items by Race/Ethnicity and Sex. 2004 Civil Rights Data Collection. Washington, D.C.: United States Department of Education. Retrieved August 30, 2007 from http://vistademo.beyond2020.com/ocr2004rv30/VistaView/Printable.
- Office for Civil Rights. (2008, February). Projected values for the nation. 2006 Civil Rights Data Collection. Washington, D.C.: United States Department of Education. Retrieved June 3, 2008 from http://ocrdata.ed.gov/ocr2006rv30/xls/2006Projected.html.
- Paxton, R.J., Valois, R.F., Watkins, K.W., Huebner, E.S., & Drane, J.W. (2007). Sociodemographic differences in depressed mood: Results from a nationally representative sample of high school adolescents. Journal of School Health, 77, 180-186.
- Reid, D.K., & Knight, M.G. (2006). Disability justifies exclusion of minority students: A critical history grounded in disability studies. Educational Researcher, 35, 18-23.
- Roberts, R.E., Roberts, C.R., & Xing, Y. (2007). Rates of DSM-IV psychiatric disorders among adolescents in a large metropolitan area. Journal of Psychiatric Research, 41, 959-967.
- Shaw, S.F. (2006). Legal and policy perspectives on transition assessment and documentation. Career Development for Exceptional Individuals, 29(2), 108-113.
- Skiba, R.J., Poloni-Staudinger, L., Gallini, S., Simmons, A.B., & Feggins-Azziz, R. (2006). Disparate Access: The disproportionality of African American students with disabilities across educational environments. Exceptional Children, 72, 411-424.
- Skiba, R.J., Simmons, A.B., Ritter, S., Kohler, K., Henderson, M., & Wu, T. (2006). The context of minority disproportionality: Practitioner perspectives on special education referral. Teachers College Record, 108, 1424-1459.
- United States Census Bureau. (2007). Section 4: Education. Statistical Abstract of the United States: 2007 (pp. 135-186). Washington, DC: Author.
- United States General Accounting Office. (2003). Special education federal actions can assist states in improving postsecondary outcomes for youth (GAO, 03-773). Washington, DC: Author. Retrieved May 28, 2008 from http://www.gao.gov/new.items/do3773.pdf.
- University System of Georgia. (2008). Ten-Year Enrollment Reports. Retrieved January 14, 2008 from http://www.usg.edu/research/students/enroll/10yr/.
- Wagner, M, Newman, L., Cameto, R., Garza, N., & Levine, P. (2005). After high school: A report from the National Longitudinal Transition Study-2 (NLTS-2). Menlo Park, CA: SRI International. Retrieved May 28, 2008 from http://www.nlts2.org.
- Zhang, D., & Katsiyannis, A. (2002). Minority representations in special education: A persistent challenge. Remedial and Special Education, 21, 180-187.
| Race/Ethnicity | Type of Disability | ||
|---|---|---|---|
| Learning Disability | Emotional Disturbance | AD/HD | |
| American Indian/Native Alaskan | 7.0% | 1.1% | N/A |
| Asian/Pacific Islander | 1.9% | 0.2% | N/A |
| Black/African-American | 6.3% | 1.9% | 8.7% |
| Hispanic/Mexican American | 5.5% | 0.5% | 6.0% |
| White/Caucasian | 5.3% | 0.9% | 9.8% |
| Other Races | N/A | N/A | 5.2% |
| Overall Prevalence Rate | 5.4% | 0.8% | 8.7% |
| Source | OCR, 2008 | OCR, 2008 | Froehlich et al. 2007 |
| Race/Ethnicity | Students Enrolled | Students with Disabilities Enrolled | Chi-Square Value | ||
|---|---|---|---|---|---|
| Percent | Number | Percent | Number | ||
| White, non-Hispanic | 63.1% | 12023074 | 65.1% | 1403556 | 1.367 |
| Black, non-Hispanic | 14.0% | 2667560 | 13.2% | 284592 | 0.986 |
| Hispanic | 12.7% | 2419858 | 12.3% | 265188 | 0.272 |
| Asian/Pacific Islander | 5.9% | 1124186 | 3.8% | 81928 | 16.115* |
| American Indian/Alaskan Native | 0.9% | 171486 | 1.2% | 25872 | 2.156 |
| Other | 3.3% | 628782 | 4.4% | 94864 | 7.91* |
Note: *p < .05.
| Race/Ethnicity | Number Enrolled | Number Evaluated | Percentage of Enrolled | Percentage of Evaluated |
|---|---|---|---|---|
| African-American | 232905 | 110 | 31.8% | 10.1% |
| Asian | 9510 | 2 | 1.3% | 0.2% |
| Caucasian | 470799 | 960 | 64.3% | 88.3% |
| Hispanic/Latino | 9594 | 9 | 1.3% | 0.8% |
| Native American | 1765 | 1 | 0.2% | 0.1% |
| Multi-Racial | 7176 | 5 | 1.0% | 0.5% |
| Total | 731749 | 1087 | 99.9% | 100% |
Figure 1. Students Enrolled and Evaluated in the Center's Service Area by Race/Ethnicity