
The researcher investigated the attitudes toward inclusive education held by 141 special educators in Nigeria. Participants were administered a modified version of the Attitudes toward Inclusion in Africa Scale (ATIAS). The scale was divided into four factors, namely, Behavior Issues, Student Needs, Resource Issues, and Professional Competency. The mean score for each of the ATIAS factors was compared by categories of eight descriptive variables. Female respondents indicated more confidence in their professional competency to teach special needs children than male respondents. Younger respondents and those with prior training in inclusion were more likely than their counterparts to believe that adequate resources were available to assist teachers to implement inclusion. Advanced formal education was associated with a greater tolerance for negative behaviors (that are sometimes connected with special needs students) and with a more positive attitude toward special supports for students with sensory disabilities. Special educators employed in Northern states were more likely than their Southern counterparts to believe that students with behavioral issues should attend their neighborhood schools. Participants expressed in open-ended comments their concerns that schools lack trained special education personnel, specialized materials, and architecturally-friendly buildings. Recommendations were made for the successful practice of inclusion in Nigeria.
Introduction
Inclusive education is a process of enhancing the capacity of the education system in any country to reach out to diverse learners. The basis of inclusion is that special needs pupils have a right to the benefits of a full school experience, with needed modifications and supports, alongside their peers without disabilities who receive general education. Inclusionists contend that special classes, separate schooling, or other forms of removing children with disabilities from the regular environment should occur only when the nature or severity of the disability of the child is such that education in regular classes (with the use of supplementary services) cannot be accomplished. Today in Nigeria, special educators, parents of students with disabilities, policy-makers and other stakeholders continue to debate the benefits and challenges of this education paradigm (Ajuwon, 2008). The discussions have been shaped largely by the principle of inclusion, which stresses that ordinary schools should cater to all children and young people, regardless of their circumstances or personal characteristics.
In both low- and high-income countries, proponents of the policy of inclusive education are now reaffirming their commitment to education for all and acknowledging the urgency of providing education for their marginalized citizens. The momentum for the inclusive education movement derives from the United Nations Educational Scientific and Cultural Organization (UNESCO's) proclamation that, among other things, emphasizes that "Regular schools with this inclusive orientation are the most effective means of combating discriminatory attitudes, creating welcoming communities, building an inclusive society and achieving education for all." p. IX. (UNESCO, 1994). Further, according to Article 18 of the same blueprint, advocates buttress their stance by noting that: "Educational policies at all levels, from the national to the local, should stipulate that a child with a disability should attend the neighborhood school that is the school that would be attended if the child did not have a disability p. 17; (UNESCO, 1994)
This latter principle appears to be what is implied in Nigeria's National Policy on Education (2004, p. 49), which tangentially references the concept of inclusive education within the broader Universal Basic Education scheme. Consequently, some vocal advocates now see inclusive education as a favored approach to responding to the needs of all students in ordinary schools. Thus, as inclusion of students with disabilities into regular classrooms becomes a reality within public schools in Nigeria, it becomes imperative to determine the perceptions of special educators toward this practice. These special educators, most of whom have been trained in the country, are gradually being recognized as key stakeholders in the implementation of the strategic inclusive practices at all levels of the education system. Despite the strategic functions of these professionals, the researcher is unaware of any published reports in which special educators' attitudes toward inclusion and disability in the country have been systematically studied. It is this realization that, in part, provided the impetus for the current empirical research.
Review of the literature and aim of the study
The strong movement in the industrialized countries to include all students in the regular public schools and classrooms (Avramidis, Buylis, & Burden, 2000; Croll & Moses, 2000; Hammond & Ingalls, 2003; Stainback & Stainback, 1990; Peterson & Beloin, 1998), and the attitudes of both regular teachers and special educators (Forlin, Douglas, & Hattie 2001; Giangreco, Dennis, Cloninger, Edelman, & Schatma, 1993; Leyser & Tappendorf, 2001; Stoler, 1992; Snyder, 1999) have been documented. However, in the context of Nigeria, much of the debate regarding inclusive education has remained theoretical and speculative; yet, we know that teacher attitude is one of the most important variables in determining the success of innovative programs in special education (Larrivee & Cook, 1979; Stoler, 1992).
According to Eiser (1986), "Attitudes are derived from individual evaluative beliefs summed together" (p. 72). The UNESCO proclamation mentioned earlier suggested that attitudinal factors could in fact affect and influence integration of special needs children in the general classroom (UNESCO, 1994). Van Reusen, Shoho, and Barker (2000) noted that attitude can be viewed as predilections toward behavior. Put another way, an individual's attitude or belief about something is thought to affect that individual's behaviors, actions, and efficacy. Consequently, the attitudes and beliefs that those involved in education hold toward inclusion and the academic capacity of special needs children may influence school learning situations and the available educational opportunities for all students (Van Reusen et al., 2000). According to Hobbs and Westling (1998), teachers with positive attitudes toward inclusion are likely to be effective in promoting inclusion because such positive attitudes will likely translate into instructional approaches that will better meet the needs of heterogeneous classroom situations. Therefore, the aim of this research is to investigate practicing special educators' attitudes and concerns regarding inclusionary practices in Nigeria.
Method
Participants
The study subjects were 141 special educators who voluntarily participated in the study. They were recruited from two national conferences on special education held in Oyo state, Nigeria in the third and fourth quarters of 2010. Four hundred surveys were distributed to special educators at both conferences who expressed an initial interest in participating in the survey. Two trained research assistants contacted these volunteers at the conferences and explained the study rationale. Each volunteer received a copy of the survey questionnaire, including a cover letter which included the Consent Form for participation and provided a definition of the term inclusive education. Each volunteer was asked to read and sign the Consent Form and to return the completed survey questionnaire in a sealed format to the conference secretary the following day. For the purpose of this study, inclusive education was defined as: "The process of providing access to general education curriculum within the general education setting to students with disabilities, with teachers who are well trained and with appropriate supports and resources."
A final total of 141 surveys, or 35 percent of those distributed to interested volunteers, were completed, returned, and deemed usable. The participants were evenly divided by gender (51.1 percent male, 48.9 percent female). Age ranged from 30 to 60 years, with a median of 42. Years of teaching experience ranged from 1 to 41, with a median of 15 years. In terms of educational qualifications, 7.8 percent had attained a National Certificate in Education (NCE), 46.8 percent had a Bachelor's degree, 37.6 percent had a Master's degree, and 7.8 percent had a Doctoral degree. The majority of respondents (72.5%) were working in states in southern Nigeria. Fifteen respondents reported some type of documented disability: blind or visually impaired (4), deaf or hard-of-hearing (8), physically handicapped (3, 1 in combination with hearing impairment), and intellectually disabled (1). Twenty respondents reported having a family member with a documented disability. Among these, 7 were blind or visually impaired, 4 were deaf or hard-of-hearing, 3 were physically handicapped, 2 had a developmental or learning disability, and 6 were intellectually disabled (1 in combination with deafness). Eighty of the respondents (56.7 percent) reported having received training in inclusive education prior to the survey.
Instrument
The researcher employed a slightly modified version of the Attitudes Toward Inclusion in Africa Scale (ATIAS) developed by Agbenyega, Deppeler, & Harvey (2005). The first section of the survey was designed to elicit participant demographic and background information. These characteristics included each participant's gender, age, highest qualification attained, teaching experience, if the participant has a documented disability, the type(s) of disability, and if the respondent has a family member with a documented disability. Additionally, the researcher sought to know whether the participant has been trained in inclusive education, and the state in Nigeria where the participant is currently teaching.
In Section 2, participants were asked to respond to 20 Likert scale items ranging from a value of 1 (strongly agree) to 7 (strongly disagree). The 20 items were divided according to the 4 factors identified by Agbenyega (2008) through factor analysis, namely: Behavioral Issues, Student Needs, Resource Issues, and Professional Competency. Responses to each item within a factor were summed and then divided by the number of items, such that the resulting factor scores ranged from 1 to 7 like the original scale items.
Behavioral Issues include characteristics that may be associated with students with disabilities which teachers might find difficult to work with in an inclusive classroom setting. A low score indicates a more positive attitude toward inclusive education. Student Needs include challenges that may be associated with students with sensory disabilities which teachers may believe require extra support that is not available in inclusive classrooms. Again, a low score indicates a more positive attitude toward inclusive education. Resource Issues relate to organizational and structural supports which may be beneficial to the teacher in an inclusive classroom. In this case, a low score indicates a more negative attitude toward inclusive education. Finally, Professional Competency describes anticipated stress and feelings of competency in dealing with students with disabilities. Again, a low score indicates a more negative attitude toward inclusive education.
Furthermore, respondents were asked to list up to three concerns that they might have regarding the practice of inclusive education at their school. These open-ended responses were reviewed and coded into nine areas of concern (yes/no). Those respondents who did not list any concerns were assigned a value of "no" for each of these nine areas of concern.
Results
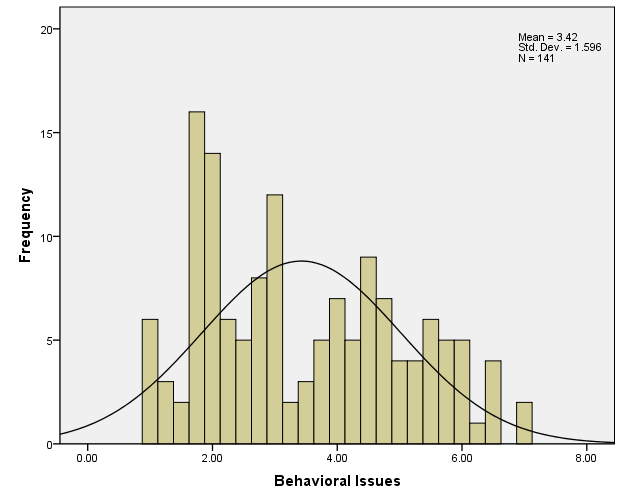
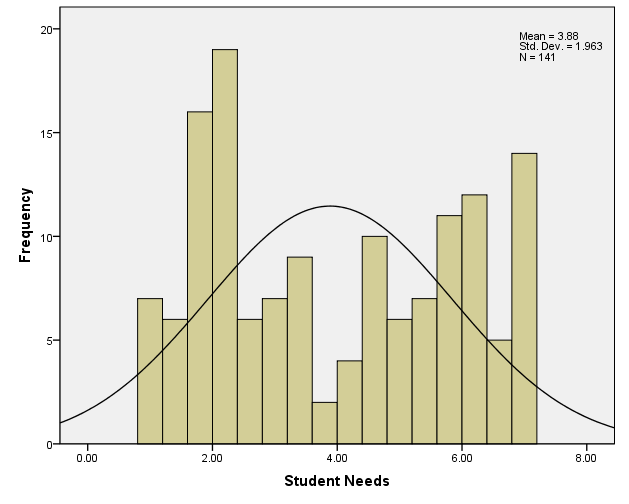
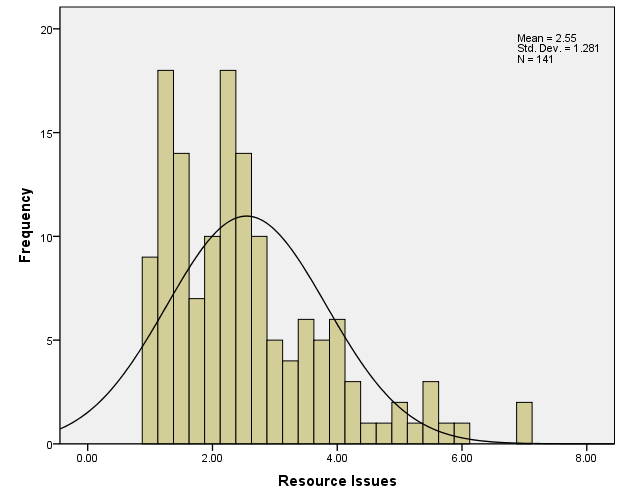
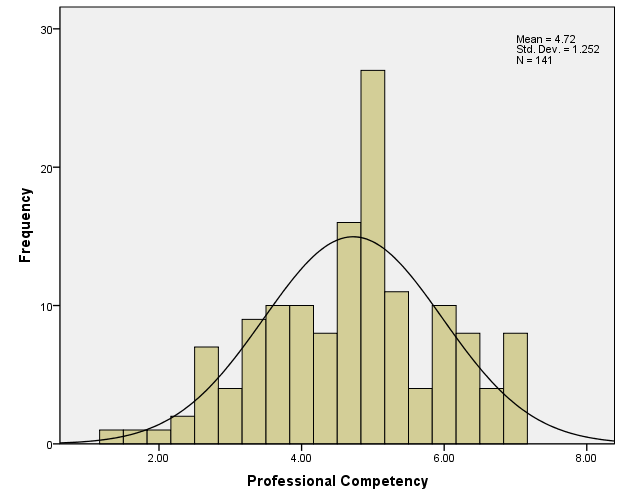
Distributions of ATIAS Scores (See Appendix) depicts the univariate distributions of each of the 4 ATIAS factors, overlaid by the normal curve. The factor Behavior has a mean (standard deviation) of 3.42 (1.60) and a median of 3.00, corresponding most closely to a Likert value of "Agree Somewhat" on the 7-point scale. The mean (SD) of the factor Student Needs is 3.88 (1.96) with a median of 3.80, corresponding most closely to the central Likert value of "Not Sure." The ATIAS factor Resources is positively skewed, with a mean (SD) of 2.55 (1.28) and a median of 2.25, corresponding to a Likert value falling between "Agree" and "Agree Somewhat." The mean (SD) of the factor Competency is 4.72 (1.25) with a median of 5.00, corresponding to the Likert value of "Disagree Somewhat." Hence, overall, these respondents indicated the most positivity toward inclusive education on items dealing with student behaviors, and the least positivity on those dealing with teachers' feelings of competence.
Distributions of ATIAS Scores
The mean score for each of the 4 ATIAS factors was compared by categories of each of the 8 descriptive variables, as displayed in Tables 1 through 8. Analysis of the 4 factors by gender (Table 1) yielded one significant comparison. Male respondents were less likely (p=0.03) than female respondents to feel professionally competent to teach students with disabilities. Examination of the factors by respondent's age (Table 2) also yielded one significant comparison. The youngest respondents (age 30-34) were more likely (p=0.003) than older respondents to believe that adequate resources were available to assist teachers with the practice of inclusion. See Table 1 and 2 provided below:
| Factor | Gender | n | Mean | Std. Dev. | t (139 df) | p (t) |
|---|---|---|---|---|---|---|
| Behavioral Issues | |
|
|
|
-0.53 | n.s. |
| |
M | 72 | 3.35 | 1.63 | |
|
| |
F | 69 | 3.50 | 1.57 | |
|
| Student Needs | |
|
|
|
-0.72 | n.s. |
| |
M | 72 | 3.77 | 1.95 | |
|
| |
F | 69 | 4.00 | 1.98 | |
|
| Resource Issues | |
|
|
|
-0.40 | n.s. |
| |
M | 72 | 2.50 | 1.35 | |
|
| |
F | 69 | 2.59 | 1.21 | |
|
| Professional Competency | |
|
|
|
-2.16* | 0.03 |
| |
M | 72 | 4.50 | 1.36 | |
|
| |
F | 69 | 4.95 | 1.09 | |
|
| Factor | Age | n | Mean | Std. Dev. | F (5,125 df) | p (F) |
|---|---|---|---|---|---|---|
| Behavioral Issues | |
|
|
|
0.58 | n.s. |
| |
30-34 | 10 | 3.51 | 1.05 | |
|
| |
35-39 | 26 | 3.20 | 1.42 | |
|
| |
40-44 | 34 | 3.17 | 1.77 | |
|
| |
45-49 | 28 | 3.73 | 1.62 | |
|
| |
50-54 | 25 | 3.62 | 1.55 | |
|
| |
55-60 | 8 | 3.64 | 1.98 | |
|
| Student Needs | |
|
|
|
1.29 | n.s. |
| |
30-34 | 10 | 4.56 | 2.03 | |
|
| |
35-39 | 26 | 3.26 | 1.83 | |
|
| |
40-44 | 34 | 3.66 | 1.90 | |
|
| |
45-49 | 28 | 4.38 | 1.96 | |
|
| |
50-54 | 25 | 4.09 | 1.91 | |
|
| |
55-60 | 8 | 4.02 | 2.40 | |
|
| Resource Issues | |
|
|
|
3.85 | 0.003* |
| |
30-34 | 10 | 3.60 | 1.51 | |
|
| |
35-39 | 26 | 2.48 | 1.06 | |
|
| |
40-44 | 34 | 2.03 | 1.16 | |
|
| |
45-49 | 28 | 2.85 | 1.34 | |
|
| |
50-54 | 25 | 2.87 | 1.33 | |
|
| |
55-60 | 8 | 1.91 | 0.62 | |
|
| Professional Competency | |
|
|
|
1.28 | n.s. |
| |
30-34 | 10 | 5.57 | 1.07 | |
|
| |
35-39 | 26 | 4.88 | 1.25 | |
|
| |
40-44 | 34 | 4.65 | 1.30 | |
|
| |
45-49 | 28 | 4.64 | 1.08 | |
|
| |
50-54 | 25 | 4.55 | 1.32 | |
|
| |
55-60 | 8 | 5.04 | 1.00 | |
|
*Mean values for Resource Issues are significantly different between age groups 30-34 versus 40-44 (p=0.007).
Table 3 displays the results of comparisons of factor mean values by highest educational qualification. A consistent downward trend in mean values for Behavioral Issues is observed as qualification increases, suggesting a greater tolerance for negative behaviors sometimes associated with students with disabilities with increasing formal education. These means differ significantly from one another overall, as indicated by the one-way ANOVA [p(F)<0.001]. Results of multiple comparison tests indicate that mean values are significantly different between Master's versus NCE (p<0.001) or Bachelor's (p=0.006), and between Doctorate versus NCE (p<0.001) or Bachelor's (p<0.001). See Table 3 provided below:
| Factor | Highest qualification | n | Mean | Std. Dev. | F (3,137 df) | p (F) |
|---|---|---|---|---|---|---|
| Behavioral Issues | |
|
|
|
12.55 | <0.001* |
| |
NCE | 11 | 4.91 | 1.21 | |
|
| |
Bachelor's | 66 | 3.83 | 1.52 | |
|
| |
Master's | 53 | 2.95 | 1.46 | |
|
| |
Doctorate | 11 | 1.78 | 0.65 | |
|
| Student Needs | |
|
|
|
13.12 | <0.001** |
| |
NCE | 11 | 6.02 | 0.82 | |
|
| |
Bachelor's | 66 | 4.35 | 1.92 | |
|
| |
Master's | 53 | 3.20 | 1.74 | |
|
| |
Doctorate | 11 | 2.20 | 1.23 | |
|
| Resource Issues | |
|
|
|
|
n.s. |
| |
NCE | 11 | 2.43 | 1.15 | |
|
| |
Bachelor's | 66 | 2.72 | 1.47 | |
|
| |
Master's | 53 | 2.42 | 1.08 | |
|
| |
Doctorate | 11 | 2.27 | 1.04 | |
|
| Professional Competency | |
|
|
|
|
n.s. |
| |
NCE | 11 | 4.52 | 0.90 | |
|
| |
Bachelor's | 66 | 4.68 | 1.28 | |
|
| |
Master's | 53 | 4.79 | 1.30 | |
|
| |
Doctorate | 11 | 4.88 | 1.24 | |
|
*Mean values for Behavioral Issues are significantly different between Master's versus NCE (p<0.001) or Bachelor's (p=0.006) and between Doctorate versus NCE (p<0.001) or Bachelor's (p<0.001).
**Mean values for Student Needs are significantly different between Bachelor's versus NCE (p=0.025), Master's versus NCE (p<0.001) or Bachelor's (p=0.003) and between Doctorate versus NCE (p<0.001) or Bachelor's (p=0.001).
A consistent downward trend in mean values for Student Needs is likewise observed as qualification increases, suggesting a more positive attitude toward special supports for sensory-disabled students with increasing formal education. Again, these means differ significantly from one another overall, as indicated by the one-way ANOVA [p(F)<0.001]. Results of multiple comparison tests indicate that mean values are significantly different between Bachelor's versus NCE (p=0.025), Master's versus NCE (p=<0.001) or Bachelor's (p=0.003), and between Doctorate versus NCE (p<0.001) or Bachelor's (p<0.001). There were no significant mean differences for any of the 4 factors by years of teaching experience (Table 4). See Table 4 provided below:
| Factor | Years of teaching experience | n | Mean | Std. Dev. | F (6,128 df) | p (F) |
|---|---|---|---|---|---|---|
| Behavioral Issues | |
|
|
|
0.85 | n.s. |
| |
1-5 | 14 | 3.59 | 1.45 | |
|
| |
6-10 | 25 | 3.26 | 1.31 | |
|
| |
11-15 | 27 | 3.27 | 1.52 | |
|
| |
16-20 | 24 | 2.95 | 1.59 | |
|
| |
21-25 | 16 | 3.44 | 1.70 | |
|
| |
26-30 | 23 | 3.91 | 1.54 | |
|
| |
31-41 | 6 | 3.44 | 2.24 | |
|
| Student Needs | |
|
|
|
1.22 | n.s. |
| |
1-5 | 14 | 4.23 | 2.12 | |
|
| |
6-10 | 25 | 3.70 | 1.75 | |
|
| |
11-15 | 27 | 3.62 | 1.83 | |
|
| |
16-20 | 24 | 3.15 | 1.91 | |
|
| |
21-25 | 16 | 4.39 | 1.98 | |
|
| |
26-30 | 23 | 4.41 | 2.00 | |
|
| |
31-41 | 6 | 3.70 | 2.51 | |
|
| Resource Issues | |
|
|
|
0.71 | n.s. |
| |
1-5 | 14 | 2.55 | 1.33 | |
|
| |
6-10 | 25 | 2.55 | 1.08 | |
|
| |
11-15 | 27 | 2.44 | 1.19 | |
|
| |
16-20 | 24 | 2.44 | 1.54 | |
|
| |
21-25 | 16 | 2.30 | 0.96 | |
|
| |
26-30 | 23 | 3.00 | 1.53 | |
|
| |
31-41 | 6 | 2.17 | 1.21 | |
|
| Professional Competency | |
|
|
|
0.44 | n.s. |
| |
1-5 | 14 | 5.02 | 1.14 | |
|
| |
6-10 | 25 | 4.73 | 1.41 | |
|
| |
11-15 | 27 | 4.67 | 1.43 | |
|
| |
16-20 | 24 | 4.80 | 1.02 | |
|
| |
21-25 | 16 | 4.33 | 1.19 | |
|
| |
26-30 | 23 | 4.64 | 1.18 | |
|
| |
31-41 | 6 | 4.83 | 1.00 | |
|
Table 5 shows the results of comparisons by region where employed. Respondents employed in northern states were more likely (p=0.02) than those employed in southern states to believe that students with various behavioral issues should attend regular schools. See Table 5 provided below:
| Factor | Region of employment | n | Mean | Std. Dev. | t (129 df) | p (t) |
|---|---|---|---|---|---|---|
| Behavioral Issues | |
|
|
|
-2.38 | 0.02 |
| |
North | 36 | 2.94 | 1.38 | |
|
| |
South | 95 | 3.68 | 1.65 | |
|
| Student Needs | |
|
|
|
-1.66 | n.s. |
| |
North | 36 | 3.50 | 1.64 | |
|
| |
South | 95 | 4.08 | 2.06 | |
|
| Resource Issues | |
|
|
|
-0.30 | n.s. |
| |
North | 36 | 2.42 | 1.27 | |
|
| |
South | 95 | 2.49 | 1.22 | |
|
| Professional Competency | |
|
|
|
-1.59 | n.s. |
| |
North | 36 | 4.44 | 1.40 | |
|
| |
South | 95 | 4.84 | 1.19 | |
|
As seen in Table 6, respondents with prior training in inclusive education were more likely (p=0.006) than those without prior training to believe that adequate resources were available to assist teachers with the practice of inclusion. There were no significant mean differences for any of the 4 factors by disability status of either the respondent (Table 7) or a member of his/her family (Table 8).
| Factor | Prior inclusion training | n | Mean | Std. Dev. | t (139 df) | p (t) |
|---|---|---|---|---|---|---|
| Behavioral Issues | |
|
|
|
0.15 | n.s. |
| |
Yes | 80 | 3.44 | 1.68 | |
|
| |
No | 61 | 3.40 | 1.50 | |
|
| Student Needs | |
|
|
|
-0.70 | n.s. |
| |
Yes | 80 | 3.78 | 2.03 | |
|
| |
No | 61 | 4.02 | 1.88 | |
|
| Resource Issues | |
|
|
|
2.79** | 0.006 |
| |
Yes | 80 | 2.79 | 1.48 | |
|
| |
No | 61 | 2.23 | 0.88 | |
|
| Professional Competency | |
|
|
|
1.66 | n.s. |
| |
Yes | 80 | 4.88 | 1.19 | |
|
| |
No | 61 | 4.52 | 1.32 | |
|
| Factor | Respondent has disability | n | Mean | Std. Dev. | t (139 df) | p (t) |
|---|---|---|---|---|---|---|
| Behavioral Issues | |
|
|
|
1.40 | n.s. |
| |
Yes | 15 | 3.97 | 1.37 | |
|
| |
No | 126 | 3.36 | 1.61 | |
|
| Student Needs | |
|
|
|
1.33 | n.s. |
| |
Yes | 15 | 4.52 | 1.94 | |
|
| |
No | 126 | 3.81 | 1.96 | |
|
| Resource Issues | |
|
|
|
0.81 | n.s. |
| |
Yes | 15 | 2.80 | 1.80 | |
|
| |
No | 126 | 2.52 | 1.21 | |
|
| Professional Competency | |
|
|
|
-0.91 | n.s. |
| |
Yes | 15 | 4.44 | 1.50 | |
|
| |
No | 126 | 4.76 | 1.22 | |
|
| Factor | Family member has disability | n | Mean | Std. Dev. | t (139 df) | p (t) |
|---|---|---|---|---|---|---|
| Behavioral Issues | |
|
|
|
-0.38 | n.s. |
| |
Yes | 21 | 3.30 | 1.50 | |
|
| |
No | 120 | 3.44 | 1.62 | |
|
| Student Needs | |
|
|
|
-0.58 | n.s. |
| |
Yes | 21 | 3.68 | 1.74 | |
|
| |
No | 120 | 3.92 | 2.00 | |
|
| Resource issues | |
|
|
|
-0.59 | n.s. |
| |
Yes | 21 | 2.39 | 1.10 | |
|
| |
No | 120 | 2.57 | 1.31 | |
|
| Professional Competency | |
|
|
|
-1.81 | n.s. |
| |
Yes | 21 | 4.27 | 1.52 | |
|
| |
No | 120 | 4.80 | 1.19 | |
|
In Table 9, the frequencies and percents of respondents listing each of the 9 areas of concern regarding the practice of inclusive education at their school are displayed. Nearly half of the respondents were concerned about a "lack of trained special education personnel." One-third or more of the respondents cited a "lack of specialized materials" and "public school buildings not user-friendly for students with disabilities" as areas of concern. "Inadequate funding", "negative attitudes on the part of regular teachers", and "absence of legislation to support inclusion" were each reported by more than 10 percent of respondents. See Table 9 provided below:
| Area of concern | Frequency (total=141) |
Percent |
|---|---|---|
| Lack of trained special educational personnel | 67 | 47.5 |
| Public school buildings not user friendly for students with disabilities | 48 | 34.0 |
| Lack of specialized instructional materials | 56 | 39.7 |
| Negative attitudes on the part of regular teachers | 17 | 12.1 |
| Negative attitudes on the part of non-disabled students | 12 | 8.5 |
| Negative attitudes on the part of parents toward inclusive education | 9 | 6.4 |
| Inadequate funding | 20 | 14.2 |
| Poor transportation system | 2 | 1.4 |
| Absence of legislation to support inclusion | 17 | 12.1 |
The three most frequent concerns were cross-tabulated against the eight descriptive variables and tested for significant associations. The only table yielding a significant association was that of the third most frequent concern (i.e., "public school buildings not user-friendly for students with disabilities") with disability status of the respondent. In Table 9, respondents with a documented disability were less likely to cite this concern than those without a documented disability [6.7% versus 37.3%; p(Χ ²)=0.04].
Discussion
While most participants stated they were tolerant of the diverse behaviors of their students within the inclusive setting, they were less confident in their abilities to manage the behaviors of students with special needs. This lack of confidence in their professional competency may indicate limited training and/or exposure to inclusive practices. Since special educators are expected to work in close concert with regular teachers to modify practices and curricula and to implement effective behavior management strategies, such lack of confidence will negatively impact inclusion outcomes (Avramidis, et al., 2000). This illustrates the need for professional development opportunities to be made available to special educators in the course of their career. Also, teacher preparation programs in Nigeria will need to be realigned to inculcate in prospective trainees the knowledge and skills that will enable them to adequately perform in varied classroom situations. It should be realized that inadequate knowledge of instructional techniques and behavioral management may negatively impact a teacher's attitude toward inclusive education, with deleterious effects on the child's learning and socialization. Therefore, if inclusive education is to succeed, special educators must feel confident and competent in taking a leadership role. They will be expected to create an increased level of awareness and understanding of disability issues and to act as change agents in school and community settings.
The issues of gender and age provided some interesting results. For instance, female respondents indicated they felt more competent to teach students with disabilities than did male respondents. This gender-related finding has been found in other studies, such as Hodge & Jansma (2000), and Leyser & Tappendorf (2001), which found that females were more supportive of and exhibited significantly more positive attitudes toward teaching students with disabilities than males. Additionally, in the present study, younger respondents felt that adequate resources were available to assist them with the practice of inclusion. This finding could indicate higher levels of motivation and enthusiasm on the part of younger teachers. Additional research could provide further information on this interpretation.
In terms of educational qualification, both a greater tolerance of potentially negative behaviors and a greater understanding of the needs of students with sensory disabilities were associated with higher formal training. The motivation of participants who have acquired advanced professional training may have led them to embrace new conceptualizations in the emerging field of inclusive education. This is a positive finding which underscores the necessity to provide ongoing professional development and training to special educators.
The lack of significant findings related to years of teaching experience contrasted with the significant findings related to age and educational qualification is surprising. The expectation would have been that an increase in years of teaching would translate into more positive attitudes toward inclusive education. Conversely, Forlin, Douglas & Hattie (1996), in their Western Australian study, noted that the most experienced teachers had the lowest level of acceptance of inclusion.
The finding of an association between the geographic locations of employed special educators in the Northern states of Nigeria with a greater tolerance toward diverse behaviors in the classroom may have a cultural or religious connotation. For instance, in the predominantly Muslim North, there is a predisposition toward viewing disabilities as "the will of Allah," and hence, there is a greater acceptance of people with disabilities within the community. There is evidence from other cultures that support the notion of Islam as being tolerant of disability. Miles (2002), writing on formal and informal resources for Afghan reconstruction, made the salient observation that "the cultural histories of Afghanistan also show that there are positive resources for enabling disabled people to play their part in community and society" (p. 947). Similarly, Crabtree (2007) wrote of the largely Muslim families in the United Arab Emirates that "… religious interpretations by parents were positive forces that worked toward acceptance of disability in a child" (p. 55). Given the extreme religiosity of the citizens, there is need to further investigate the influences that various religions exert over disability and family life in contemporary Nigerian society.
In the domain of adequacy of resources, including coping skills, respondents with prior training in inclusive education were more positively disposed than were those without such training. This is in line with studies elsewhere that concluded, inter alia, that teachers may oppose inclusion on the basis of insufficient material resources and/or inadequate training (Agbeyenga, 2007; Cornoldi et al., 1998; Kuester, 2000; Scruggs & Mastropieri, 1996). Agbeyenga, commenting on the negative attitudes of Ghanaian teachers toward inclusive education, noted that "… without sufficient resources and support inclusive education was not possible and doomed [sic]" (p. 52). Cornoldi and colleagues, reporting on their findings of teachers in Italy (an industrialized country), found a very low level of agreement regarding teachers' perceptions of the adequacy of their instructional materials to enhance inclusion. In their own research synthesis, Scruggs & Mastropieri (1996) concluded that teachers indicated, among other things, the need for personnel resources to implement mainstreaming objectives, as well as adequate curriculum materials and other classroom equipment to meet the needs of children with exceptionalities. The less-than-optimistic reactions of participants in the current study suggest that educating pupils with disabilities in ordinary schools in Nigeria requires substantial increases in resources for inclusionary practices to succeed.
It is noteworthy that the presence of a disability in either the respondent or his/her family member was not associated with attitude toward inclusion as measured by the ATIAS. This is an unexpected finding, and additional studies will need to be carried out to better understand these results.
The top concerns reported by respondents regarding the practice of inclusive education in their school centered upon what are ultimately funding decisions, i.e., educators with unique training, specialized instructional materials, and design of architecturally-friendly school buildings. The question often asked by keen observers is: "How can developing countries, with so many competing priorities, rise to the challenge of providing effectively the financial, manpower and technological resources to meet the needs of their diverse school populations?" Mushoriwa (2001) reported on the large class size, heavy workload and lack of resources experienced by regular teachers involved in teaching children who are blind in Zimbabwe. Ajuwon (2011), in his investigation of the sentiments, attitudes and concerns of special education trainees in Nigeria, also documented the problems associated with over-crowded, but under-resourced classrooms and a limited number of professionals with expertise in inclusion. Although the creation of inclusive schools is the most effective means for achieving education and equity for all (Ainscow & Miles, 2009; UNESCO, 2001a; UNESCO, 2001b), there is a need to accord this objective a preeminent place on the nation's development agenda. It is only in this way that quality and sufficient resources can be obtained. The concern expressed regarding adequacy of resources in the present study is not surprising and indicates an urgency for the stakeholders to resolve this dilemma.
Limitation of the study
The participants are a convenience sample of educators attending two national conferences on special education, and thus, are not representative of all special educators throughout the country. For example, participants represented only 17 out of the 36 states in the country. A larger sample representative of all school districts that currently practice inclusion in the 36 states would be recommended.
Recommendations
The implementation of inclusion in Nigeria will inevitably create new and increased demands on special educators, as well as other stakeholders. With the growing number of inclusive schools, special educators are expected to make adaptations and accommodations to the curriculum, their instructional techniques and evaluation procedures, as well as their classroom behavior management styles. Those specialists who are already engaged in inclusive schooling must be provided with sufficient instructional resources, while at the same time encouraged to continue their efforts to reach out to all learners.
Education should be seen by the government as a basic human right and the foundation for a more just and equal society (UNESCO, 2009). This implies adequate funding to meet the target goals and objectives for equalizing learning for all pupils, including those with disabilities in our public schools. While the Nigerian government has embraced the philosophy of inclusive education in regular schools, and has since 1974 trained thousands of specialists to provide high-quality education to special needs children (Ajuwon, 2011), there is need for the proper deployment of these professionals, and an ongoing evaluation of their attitudes and concerns.
As the data suggest from this project, special educators experience a number of constraints that are likely to affect their attitudes. These professionals must be given the opportunity to increase their sense of accountability for bringing about positive change outcomes.
Future research in this area should utilize other methods of data collection for this type of empirical research (for example, interviews and observations of actual classroom instructional behaviors), in order to provide more robust and authentic insights into the opinions of special educators toward inclusive education.
References
- Agbenyega, J. S., Deppeler, J., & Harvey, D. (2005). Attitudes toward Inclusive Education in Africa Scale (ATIAS): An instrument to measure teachers" attitudes toward inclusive education for students with disabilities. Journal of Research and Development in Education, 5. 1-15.
- Agbenyega, J. (2007). Examining Teachers' Concerns and Attitudes to Inclusive Education in Ghana. International Journal of Wholeschooling. Vol. 3 No. 1. 41-56.
- Ainscow, M. & Miles S. (2009). Developing Inclusive Education Systems: How can we move policies forward? Retrieved at: www.ibe.unesco.org. June 16.
- Ajuwon, P. M. (2008) Inclusive Education for Students With Disabilities in Nigeria: Benefits, Challenges and Policy Implications. International Journal of Special Education, 11-17.
- Ajuwon, P. M. (2011). Trainees' Perceptions of Inclusive Education in Nigeria: A Preliminary Report. Ajobiewe T., Adebiyi, B. A., & Nkangwung, F. O. (Eds.): Contemporary Issues in the Education of Persons with Visual Impairment. Ibadan, Nigeria: Glory-Land Publishing Co. 6-24.
- Avramidis, E., Buylis, P., & Burden, R. (2000). A Survey into Mainstream Teachers' Attitudes toward the Inclusion of Children with Special Educational Needs in the Ordinary School in One Local Education Authority. Education Psychology, 20 (2), 191-212.
- Cornoldi, C., Terreni, A., Scruggs, T. E., & Mastropieri, M. A. (1999). Teacher Attitudes in Italy After twenty years of Inclusion. Remedial and Special Education, 19 (6). 350-356.
- Crabtree, S. A. (2007). Family Responses to the Social Inclusion of Children with Developmental Disabilities in the United Arab Emirates. Disability and society, Vol. 22, No. 1. 49-62.
- Croll, P. & Moses, D. (2000). Ideologies and Utopias: Education Professionals' Views of Inclusion. European Journal of Special Education, 15(1), 1-12.
- Eiser, J. R. (1986). Social Psychology: Attitudes, Cognition, and Social Behavior. Cambridge: Cambridge University Press.
- Giangreco, M. F., Dennis, R., Cloninger, C., Edelman, S., & Schattman, R. (1993). "I've counted on Jon:" Transformational Experiences of Teachers Educating Students With Disabilities. Exceptional Children, 59(4), 359-372.
- Hammond, H., & Ingalls, L. (2003). Teachers Attitudes Toward Inclusion : Survey Results from Elementary School Teachers in Three Southwestern Rural School Districts. Rural Special Education Quarterly, 22(2), 24-30.
- Hobbs, T. & Westling, D. L. (1998) Promoting Successful Inclusion Through Collaborative Problem Solving. Teaching Exceptional Children, 31 (1). 12-19.
- Hodge, S. R., et. al., Physical education majors' attitudes toward teaching students with disabilities. Teacher Education and Special Education v. 23 no. 3 (Summer 2000) p. 211-24
- Kuester, V. M. (2000). 10 Years On: Have Teacher Attitudes Toward the Inclusion of Students with Disabilities Changed? Proceedings, International Special Education Congress. Manchester: 2000.
- Larrivee, B., & Cook, L. (1979). Mainstreaming: A study of the variables affecting teacher attitude. The Journal of Special Education, 13. 315-324.
- Leyser, Y. & Tappendorf, K. (2001). Are attitudes regarding mainstreaming changing? A case of teachers in two rural schools. Education, 121. 751-61.
- Miles, M. (2002). Formal and Informal Resources for Afghan Reconstruction. Third World Quarterly, Vol. 23, No. 5. 945-959.
- Mushoriwa, T. (2001). A study of the attitudes of primary school teachers in Harare towards the inclusion of blind children in regular classes. British Journal of Special Education, Vol. 28, No. 3.
- National Policy on Education (2004). Section 10: Special Needs Education. Abuja, Nigeria NERDC.
- Scruggs, T. E. & Mastropieri, M. A. (1996). Teacher Perceptions of Mainstreaming/Inclusion, 1958-1995: A research synthesis. Exceptional Children, 63 (1) 59-75.
- Snyder, R. F. (1999). Inclusion: A Qualitative Study of In-service General Education Teachers' Attitudes and Concerns. Education, 120.1. Fall. 173.
- Stoler, R. D. (1992). Perceptions of Regular Education Teachers Toward Inclusion of All Handicapped Students in Their Classrooms. Clearing House. Vol. 66, Issue 1. 60-63.
- UNESCO (2009). Policy Guidelines on Inclusion in Education. Paris, France. (http://unesdoc.unesco.org/images/0017/001778/177849e.pdf)
- UNESCO (2001a). Open Files on Incusive Education: Support Materials for Managers and Administrators. Paris: UNESCO.
- UNESCO (2001b). Understanding and Responding to Children's Needs in Inclusive Classrooms: A guide for Teachers. Paris: UNESCO.
- UNESCO (1994). The Salamanca Statement and Framework for Action on Special Needs Education. Adopted by the World Conference on Special Needs Education: Access and Quality. Salamanca, Spain, 7-10 June.
- VanReusen, A. K., Shoho, A., R., & Barker, K. S. (2000). High school teacher attitudes toward inclusion. High School Journal. 84.2
